


![]()

ESA Observing the Earth 
zdroje zpráv:
ERS-1: the first image
15.7.2021 10:00 Video:
00:23:29
Video:
00:23:29
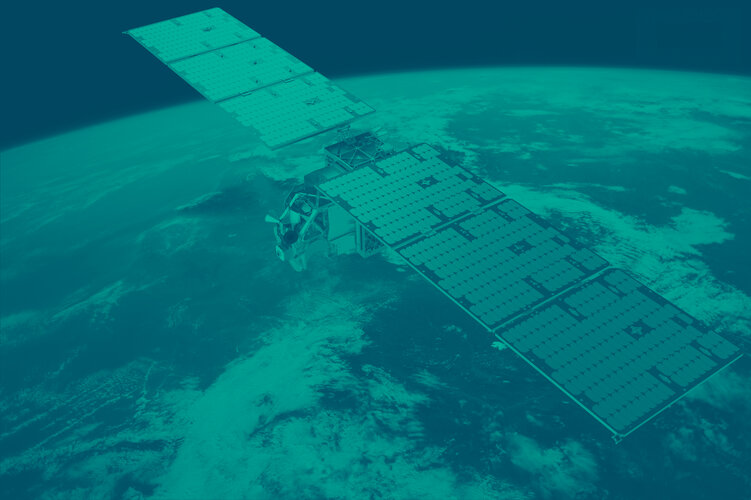
ESA’s first Earth observation mission dedicated to understanding our planet, the European Remote Sensing satellite (ERS-1), was launched into orbit on 17 July 1991. At the time, it was the most sophisticated Earth observation spacecraft developed and launched by Europe.
Thirty years ago, as the team went through the launch and early-orbit phase, the first synthetic aperture radar images were awaited in Kiruna and Fucino. Featuring video footage taken in 1991, the team involved tells the story of the anxious moments and important breakthroughs they made as the first images arrived.
Features interviews with:
Stephen Coulson, Former Earth Observation Applications Engineer
Mark Doherty, Former Head of ERS Product Control Service
Henri Laur Former Head of Processing of ERS-1 SAR data
ERS-1 first image: solving the mystery
15.7.2021 10:00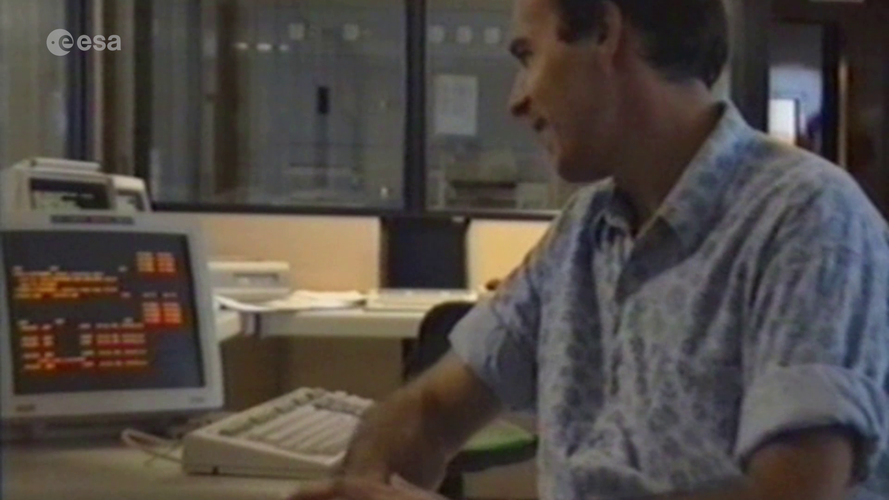 Video:
00:23:29
Video:
00:23:29
ESA’s first Earth observation mission dedicated to understanding our planet, the European Remote Sensing satellite (ERS-1), was launched into orbit on 17 July 1991. At the time, it was the most sophisticated Earth observation spacecraft developed and launched by Europe.
Thirty years ago, as the team went through the launch and early-orbit phase, the first synthetic aperture radar images were awaited in Kiruna and Fucino. Featuring video footage taken in 1991, the team involved tells the story of the anxious moments and important breakthroughs they made as the first images arrived. Get an insider view into the problem-solving moments from inside one of ESA's processing rooms.
Features interviews with:
Stephen Coulson, Former Earth Observation Applications Engineer
Mark Doherty, Former Head of ERS Product Control Service
Henri Laur, Former Head of Processing of ERS-1 SAR data
ERS-1: the first image
15.7.2021 10:00
Video:
00:23:29
ESA’s first Earth observation mission dedicated to understanding our planet, the European Remote Sensing satellite (ERS-1), was launched into orbit on 17 July 1991. At the time, it was the most sophisticated Earth observation spacecraft developed and launched by Europe.
Thirty years ago, as the team went through the launch and early-orbit phase, the first synthetic aperture radar images were awaited in Kiruna and Fucino. Featuring video footage taken in 1991, the team involved tells the story of the anxious moments and important breakthroughs they made as the first images arrived.
Features interviews with:
Stephen Coulson, Former Earth Observation Applications Engineer
Mark Doherty, Former Head of ERS Product Control Service
Henri Laur Former Head of Processing of ERS-1 SAR data
ERS-1 first image: solving the mystery
15.7.2021 10:00
Video:
00:23:29
ESA’s first Earth observation mission dedicated to understanding our planet, the European Remote Sensing satellite (ERS-1), was launched into orbit on 17 July 1991. At the time, it was the most sophisticated Earth observation spacecraft developed and launched by Europe.
Thirty years ago, as the team went through the launch and early-orbit phase, the first synthetic aperture radar images were awaited in Kiruna and Fucino. Featuring video footage taken in 1991, the team involved tells the story of the anxious moments and important breakthroughs they made as the first images arrived. Get an insider view into the problem-solving moments from inside one of ESA's processing rooms.
Features interviews with:
Stephen Coulson, Former Earth Observation Applications Engineer
Mark Doherty, Former Head of ERS Product Control Service
Henri Laur Former Head of Processing of ERS-1 SAR data
ESA and NASA join forces to understand climate change
13.7.2021 19:00
Climate change is, arguably, the biggest environmental challenge the global population faces today. To address this major issue, decision-makers not only need accurate information on how our world is changing now, but also predictions on what may happen in the future. A sound knowledge of how Earth behaves as one system is the foundation to all of this – and the pieces of this complex puzzle come largely from satellites orbiting our planet. To ensure that data from Earth-observing satellites are used to their best advantage, further science and, ultimately, bring the most benefit to humankind, ESA and NASA have formed a strategic partnership for Earth science and climate change.
Swarm yields new insight into animal migration
9.7.2021 14:40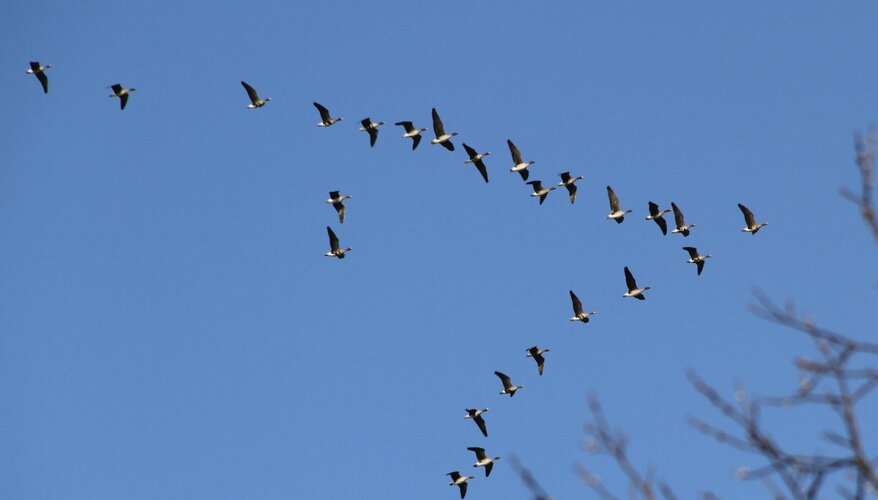
Using measurements from ESA’s Earth Explorer Swarm mission, scientists have developed a new tool that links the strength and direction of the magnetic field to the flight paths of migrating birds. This is a huge step forward to understanding how animals use Earth’s magnetic field to navigate vast distances.
Earth from Space: Gulf of Martaban
9.7.2021 10:00
The Gulf of Martaban, an arm of the Andaman Sea located in southern Myanmar, is featured in this false-colour image captured by the Copernicus Sentinel-2 mission.
Earth from Space: Gulf of Martaban
9.7.2021 10:00
The Gulf of Martaban, an arm of the Andaman Sea located in southern Myanmar, is featured in this false-colour image captured by the Copernicus Sentinel-2 mission.
 Image:
A touch of sun
Image:
A touch of sun
New satellite data techniques reveal coastal sea-level rise
7.7.2021 12:15
For the hundreds of millions of people living in coastal regions around the world, rising seas driven by climate change pose a direct threat. In order for authorities to plan appropriate protection strategies, accurate information on sea-level rise close to the coast is imperative. For various reasons, these measurements are difficult to get from satellites. However, new ESA-funded research demonstrates how a specific way of processing satellite altimetry data now makes it possible to determine sea-level change in coastal areas with millimetre per year accuracy, and even if the sea is covered by ice.
Earth from Space: North Frisian Islands
2.7.2021 10:00
Part of the Frisian Islands, a low-lying archipelago just off the coast of northern Europe, is visible in this image captured by the Copernicus Sentinel-2 mission.
Earth from Space: North Frisian Islands
2.7.2021 10:00
Part of the Frisian Islands, a low-lying archipelago just off the coast of northern Europe, is visible in this image captured by the Copernicus Sentinel-2 mission.
Canada–US heatwave
1.7.2021 16:49 Image:
The heatwave now hitting parts of western Canada and the US has been particularly devastating. This Copernicus Sentinel-3 image shows land surface temperature.
Image:
The heatwave now hitting parts of western Canada and the US has been particularly devastating. This Copernicus Sentinel-3 image shows land surface temperature.
Canada–US heatwave
1.7.2021 16:49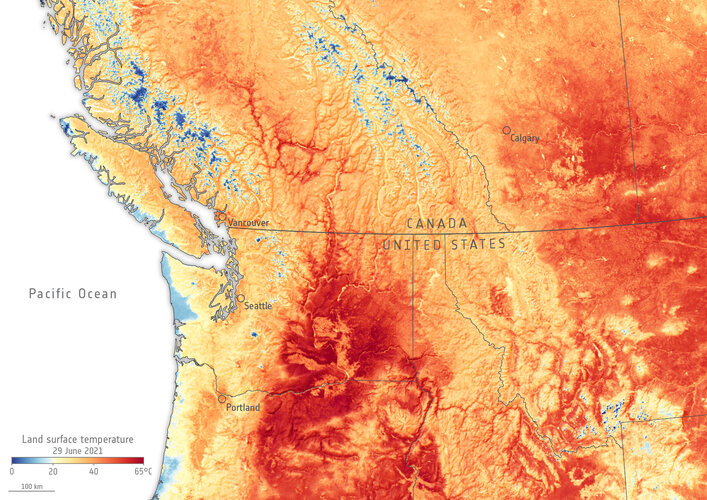 Image:
The heatwave now hitting parts of western Canada and the US has been particularly devastating. This Copernicus Sentinel-3 image shows land surface temperature.
Image:
The heatwave now hitting parts of western Canada and the US has been particularly devastating. This Copernicus Sentinel-3 image shows land surface temperature.
Shoemaker Crater, Australia
30.6.2021 10:30 Image:
For Asteroid Day, the Copernicus Sentinel-2 mission takes us over the Shoemaker Impact Structure (formerly known as Teague Ring) in Western Australia.
Image:
For Asteroid Day, the Copernicus Sentinel-2 mission takes us over the Shoemaker Impact Structure (formerly known as Teague Ring) in Western Australia.
Earth from Space: Lake Mar Chiquita
25.6.2021 10:00
The Copernicus Sentinel-1 mission takes us over Lake Mar Chiquita – an endorheic salt lake in the northeast province of Córdoba, Argentina.
ESA and EU celebrate a fresh start for space in Europe
22.6.2021 10:15Press Release N° 20–2021
After months of constructive negotiations, ESA and EU signed today a new Financial Framework Partnership Agreement (FFPA) in a ceremony to celebrate the launch of the new EU space programme.
New sea-level monitoring satellite goes live
21.6.2021 16:30
Following liftoff last November and more than six months spent carefully calibrating the most advanced mission dedicated to measuring sea-level rise, Copernicus Sentinel-6 Michael Freilich is now operational – meaning that its data are available to climate researchers, ocean-weather forecasts and other data users.
Stark reality of Californian drought from space
21.6.2021 10:30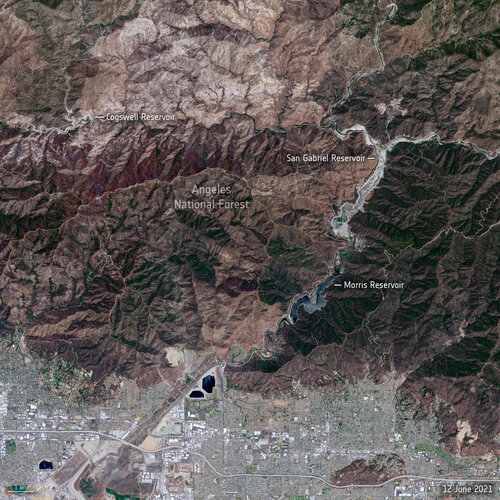 Image:
Stark reality of Californian drought from space
Image:
Stark reality of Californian drought from space
Take part in ESA’s Space App Camp
21.6.2021 9:20
ESA is inviting up to 25 committed mobile app developers and specialists in artificial and machine learning related to observing Earth from space to join this year’s Space App Camp, which will be a virtual event over eight weeks, from 20 July to 20 September.
Earth from Space: Tana River
18.6.2021 10:00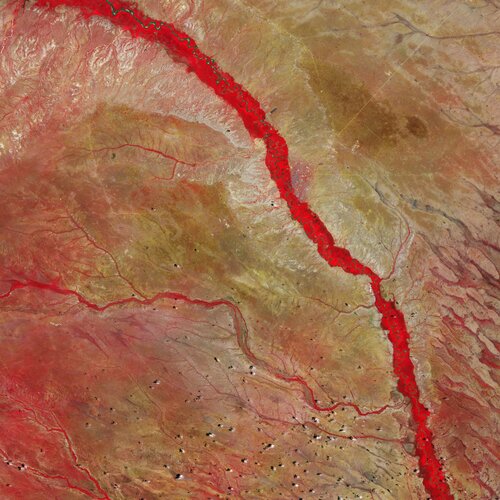
The Tana River, Kenya’s longest river, is featured in this false-colour image captured by the Copernicus Sentinel-2 mission.
Earth from Space: Tana River
18.6.2021 10:00
The Tana River, Kenya’s longest river, is featured in this false-colour image captured by the Copernicus Sentinel-2 mission.


Satellites reveal cause of Chamoli disaster
14.6.2021 11:30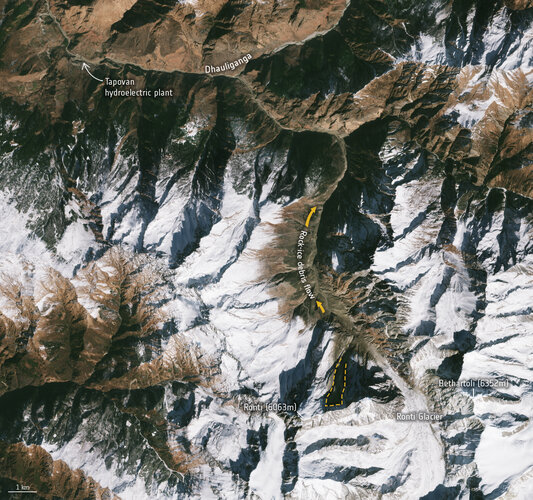
A new study using satellite evidence confirms that a rock and ice avalanche caused the Chamoli disaster in India earlier this year. The resulting mud and debris flood led to massive destruction downstream.
Earth from Space: Chongqing, China
11.6.2021 10:00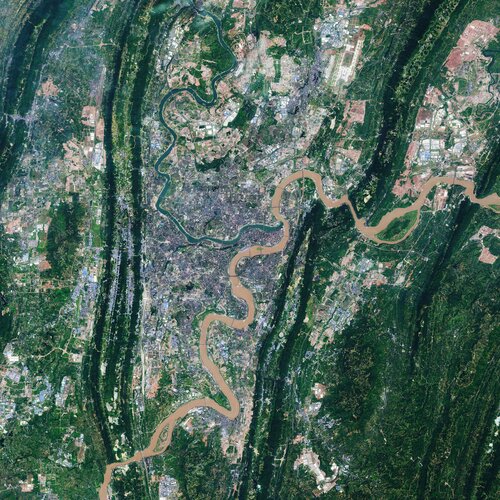
Chongqing, the largest municipality in China, is featured in this Copernicus Sentinel-2 image.
Earth from Space: Chongqing, China
11.6.2021 10:00
Chongqing, the largest municipality in China, is featured in this Copernicus Sentinel-2 image.
Four mission ideas to compete for Earth Explorer 11
10.6.2021 12:20
As part of ESA’s commitment to develop and build satellite missions that push the boundaries of satellite technology and Earth science, four new mission ideas – Cairt, Nitrosat, Seastar and Wivern – have been selected to enter pre-feasibility study and compete to be the eleventh Earth Explorer mission.
Forest degradation primary driver of carbon loss in the Brazilian Amazon
10.6.2021 11:00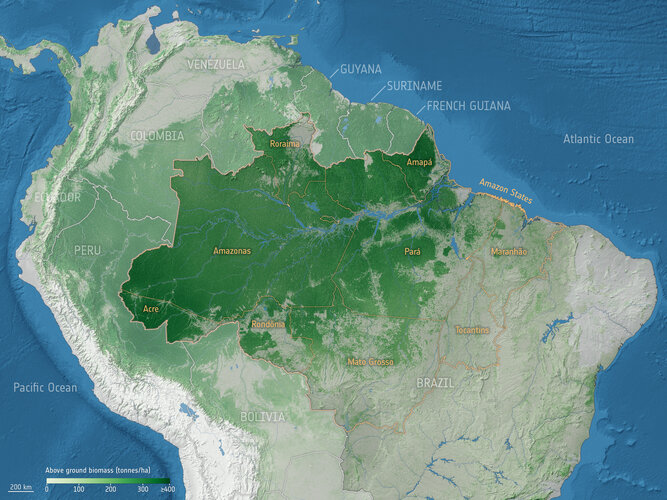
Forest degradation has become the largest process driving carbon loss in the Brazilian Amazon, according to a recent study using ESA satellite data.
Arctic coastal sea ice thinning twice as fast than thought
10.6.2021 9:10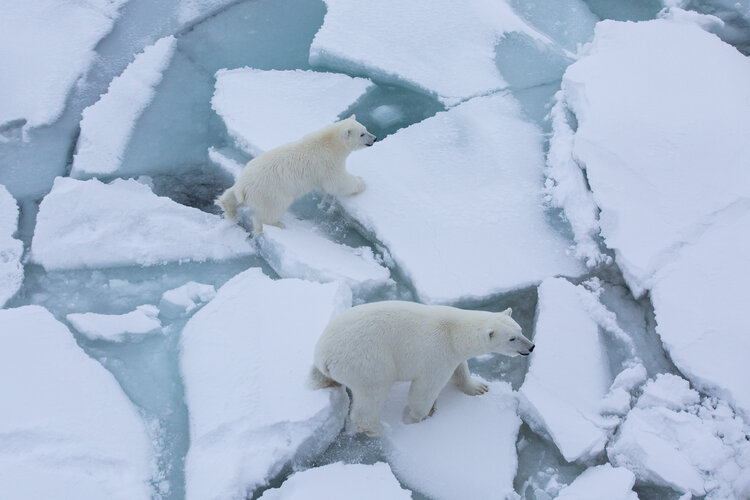
Research based on ice-thickness data from ESA’s CryoSat and Envisat missions along with a new model of snow has revealed that sea ice in the coastal regions of the Arctic may be thinning twice as fast as thought.
Earth from Space: Warsaw, Poland
4.6.2021 10:00
The Copernicus Sentinel-2 mission takes us over Warsaw – the capital and largest city of Poland.
Earth from Space: Warsaw, Poland
4.6.2021 10:00
The Copernicus Sentinel-2 mission takes us over Warsaw – the capital and largest city of Poland.
CryoSat reveals ice loss from glaciers in Alaska and Asia
1.6.2021 9:00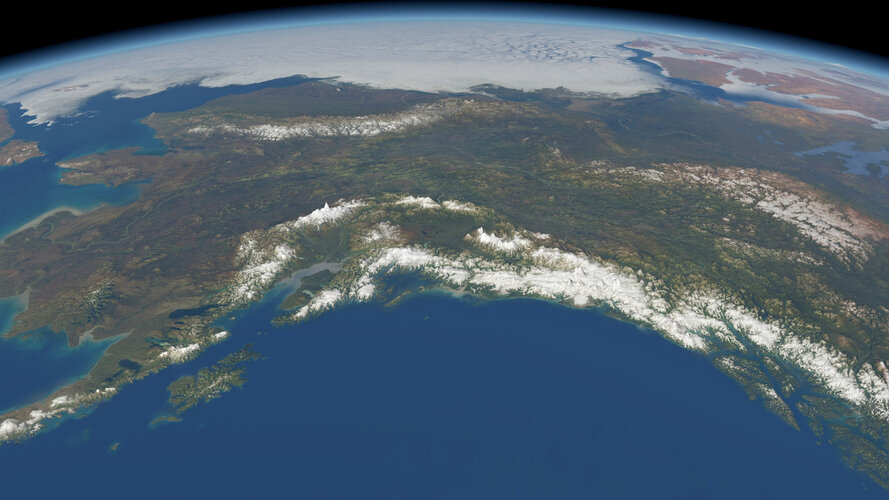
As our climate warms, ice melting from glaciers around the world is one of main causes of sea-level rise. As well as being a major contributor to this worrying trend, the loss of glacier ice also poses a direct threat to hundreds of millions of people relying on glacier runoff for drinking water and irrigation. With monitoring mountain glaciers clearly important for these reasons and more, new research, based on information from ESA’s CryoSat mission, shows how much ice has been lost from mountain glaciers in the Gulf Alaska and in High Mountain Asia since 2010.
Save the date: Living Planet Symposium 2022
31.5.2021 10:00
It’s time to block your agendas to make sure you don’t miss out on the biggest Earth observation conference in the world – ESA’s next Living Planet Symposium, which is set to take place on 23–27 May 2022 at the World Conference Center in Bonn, Germany.
Earth from Space: The Great Lakes
28.5.2021 10:00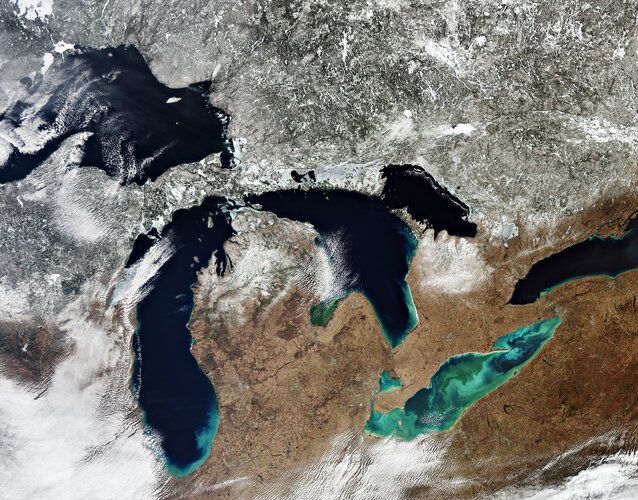
All five of North America’s Great Lakes are pictured in this spectacular image captured by the Copernicus Sentinel-3 mission: Lake Superior, Michigan, Huron, Erie, and Ontario.
How ESA boosts climate education
27.5.2021 10:37
A series of fascinating new learning resources are enabling teachers in the UK to encourage the next generation of climate pioneers.
The freely available lesson plans and activities – which add to ESA’s portfolio of space-powered climate learning materials – were highlighted at the Climate Change Teacher Conference, a live-streamed online summit for British primary and secondary school educators that took place this week.
Arctic sea ice succumbs to Atlantification
21.5.2021 11:45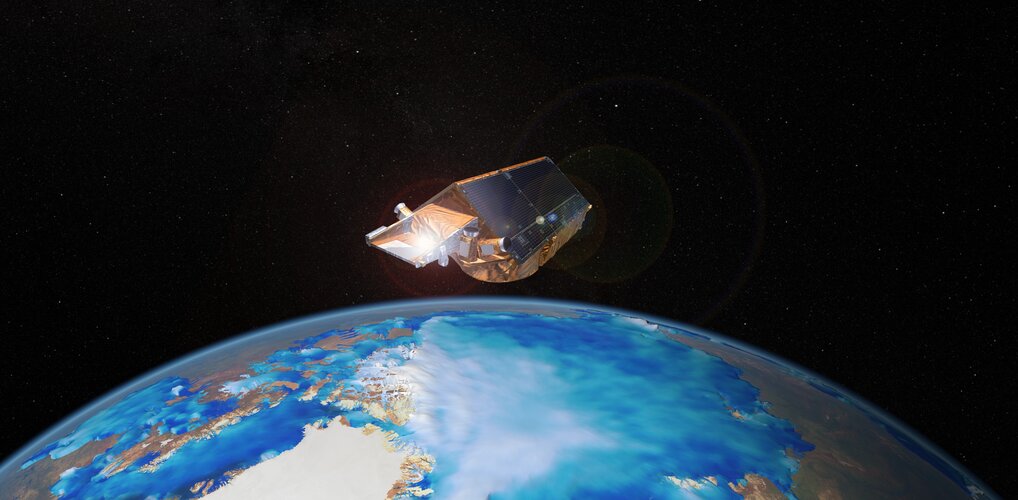
With alarm bells ringing about the rapid demise of sea ice in the Arctic Ocean, satellite data have revealed how the intrusion of warmer Atlantic waters is reducing ice regrowth in the winter. In addition, with seasonal ice more unpredictable than ever, ESA’s SMOS and CryoSat satellites are being used to improve sea-ice forecasts, which are critical for shipping, fisheries and indigenous communities, for example.
Earth from Space: Los Cabos, Mexico
21.5.2021 10:00
The Copernicus Sentinel-2 mission takes us over Los Cabos – a municipality on the southern tip of Mexico's Baja California Peninsula.
Earth from Space: Los Cabos, Mexico
21.5.2021 10:00
The Copernicus Sentinel-2 mission takes us over Los Cabos – a municipality on the southern tip of Mexico's Baja California Peninsula.
Join ESA, NASA and JAXA for the Earth observation COVID-19 hackathon
20.5.2021 12:10
Do you have ideas on how Earth observation data can solve some of the challenges related to the COVID-19 pandemic? If so, ESA, NASA and JAXA invite you to join a virtual Earth Observation Dashboard Hackathon taking place on 23-29 June. Registration for the hackathon opens today.
Meet the world’s largest iceberg
19.5.2021 9:00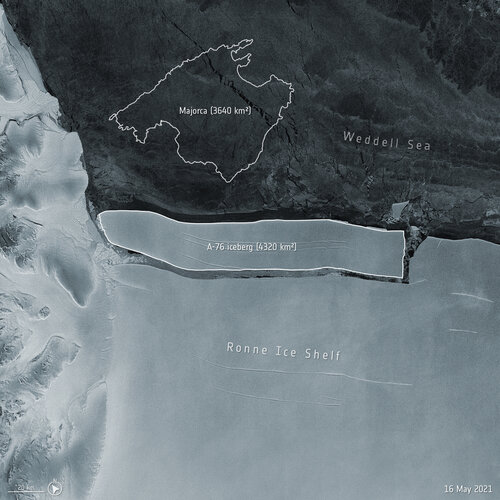 Image:
An enormous iceberg has calved from the western side of the Ronne Ice Shelf, in the Weddell Sea, in Antarctica. The iceberg, dubbed A-76, measures around 4320 sq km in size and is currently the largest berg in the world.
Image:
An enormous iceberg has calved from the western side of the Ronne Ice Shelf, in the Weddell Sea, in Antarctica. The iceberg, dubbed A-76, measures around 4320 sq km in size and is currently the largest berg in the world.
The curious incident of Swarm and sprites in the night-time
18.5.2021 15:00We are all familiar with the bolts of lightning that accompany heavy storms. While these flashes originate in storm clouds and strike downwards, a much more elusive type forms higher up in the atmosphere and shoots up towards space. So, what are the chances of somebody taking photographs of these rarely seen, brief ‘transient luminous events’ at the exact same time as a satellite orbits directly above with the event leaving its signature in the satellite’s data?
Monitoring coastal changes in Greece
18.5.2021 9:50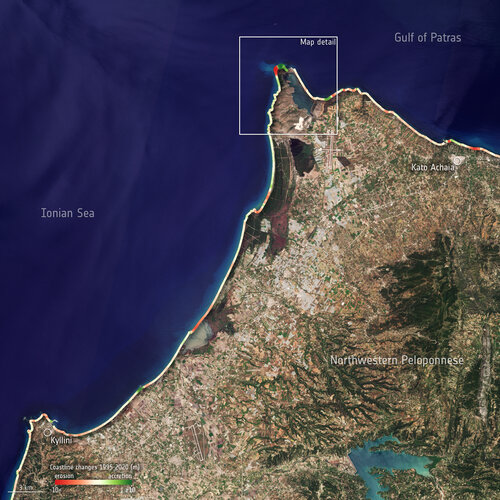
Hundreds of satellite images spanning over 25 years have been compiled to show the evolution of Greece’s ever-changing coastlines.
Earth from Space: Qeshm Island
14.5.2021 10:00
The Copernicus Sentinel-2 mission takes us over Qeshm Island – the largest island in Iran.
Earth from Space: Qeshm Island
14.5.2021 10:00 Video:
00:03:25
Video:
00:03:25
This week's edition of the Earth from Space programme features a Copernicus Sentinel-2 image of Qeshm Island – the largest island in Iran.
See also Qeshm Island, Iran to download the image.
Earth from Space: Morbihan, France
7.5.2021 10:00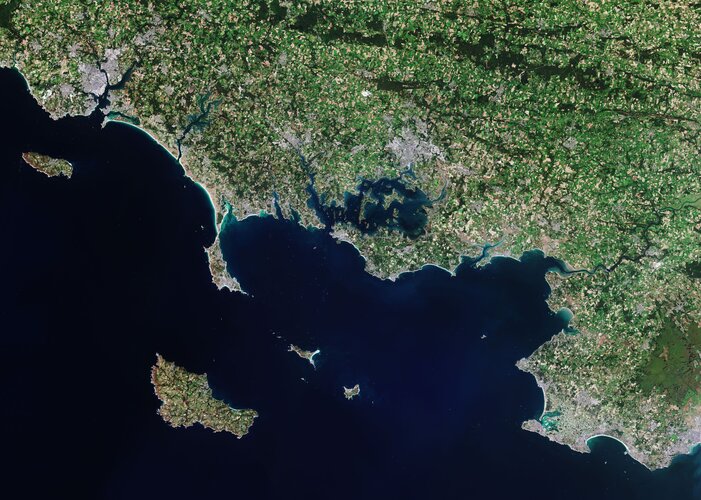
The Copernicus Sentinel-2 mission takes us over Morbihan – a French department in the south of Brittany.
Earth from Space: Morbihan, France
7.5.2021 10:00
The Copernicus Sentinel-2 mission takes us over Morbihan – a French department in the south of Brittany.
Glacier avalanches more common than thought
30.4.2021 11:00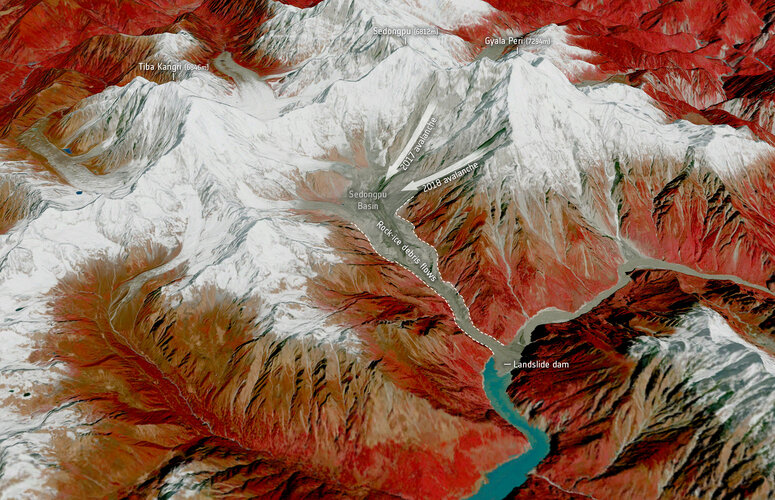
One tends to think of mountain glaciers as slow moving, their gradual passage down a mountainside visible only through a long series of satellite imagery or years of time-lapse photography. However, new research shows that glacier flow can be much more dramatic, ranging from about 10 metres a day to speeds that are more like that of avalanches, with obvious potential dire consequences for those living below.
Earth from Space: Antofagasta, Chile
30.4.2021 10:00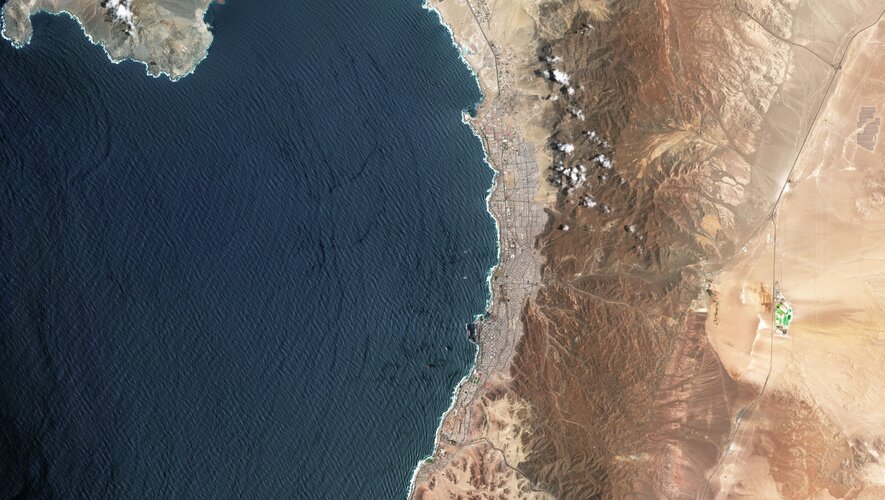
Antofagasta, a port city in northern Chile, is featured in this image captured by the Copernicus Sentinel-2 mission.
Earth from Space: Antofagasta, Chile
30.4.2021 10:00
Antofagasta, a port city in northern Chile, is featured in this image captured by the Copernicus Sentinel-2 mission.
Forest measuring satellite passes tests with flying colours
28.4.2021 11:53
With challenges imposed by the Covid pandemic, engineers building and testing ESA’s Biomass satellite have had to come up with some clever working methods to keep on track whilst adhering to safety rules. The result is that the satellite structure is not only complete, but has also undergone a series of demanding tests to ensure it will withstand the rigours of liftoff – all bringing the launch of this extraordinary forest carbon mapping mission one step closer.
Copernicus Masters 2021 submissions open
26.4.2021 12:30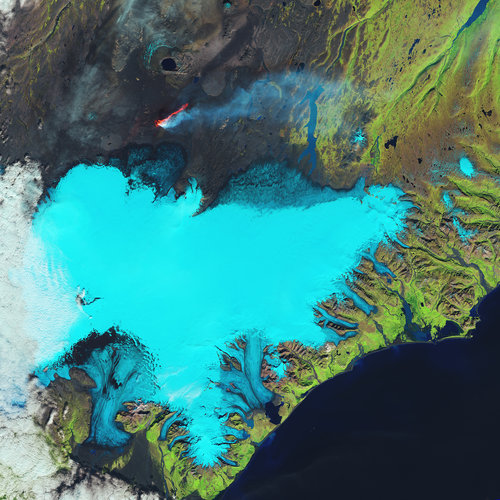
The Copernicus Masters 2021 competition is now open for submissions. This international competition awards prizes to innovative solutions, developments and ideas for business and society that use satellite data from the Copernicus programme.
Earth from Space: Laizhou Bay
23.4.2021 10:00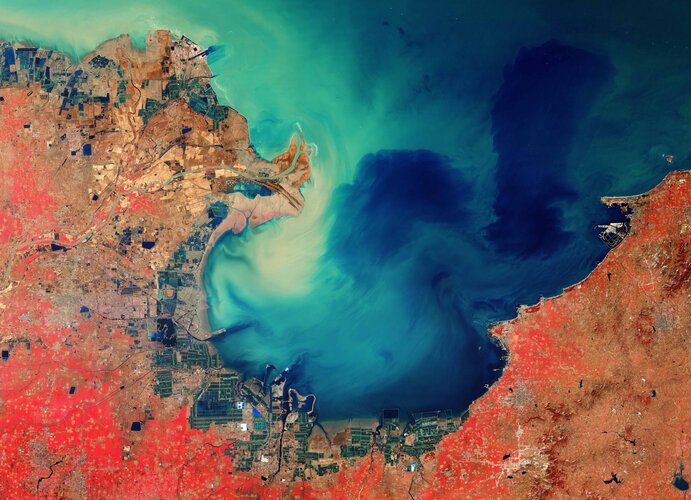
The Copernicus Sentinel-2 mission takes us over the sediment-stained waters in Laizhou Bay, located on the southern shores of the Bohai Sea, on the east coast of mainland China.
Earth from Space: Laizhou Bay
23.4.2021 10:00
The Copernicus Sentinel-2 mission takes us over the sediment-stained waters in Laizhou Bay, located on the southern shores of the Bohai Sea, on the east coast of mainland China.
Satellites highlight a 30-year rise in ocean acidification
21.4.2021 11:00
Oceans play a vital role in taking the heat out of climate change, but at a cost. New research supported by ESA and using different satellite measurements of various aspects of seawater along with measurements from ships has revealed how our ocean waters have become more acidic over the last three decades – and this is having a detrimental effect on marine life.
ESA and FAO unite to tackle food security and more
20.4.2021 12:00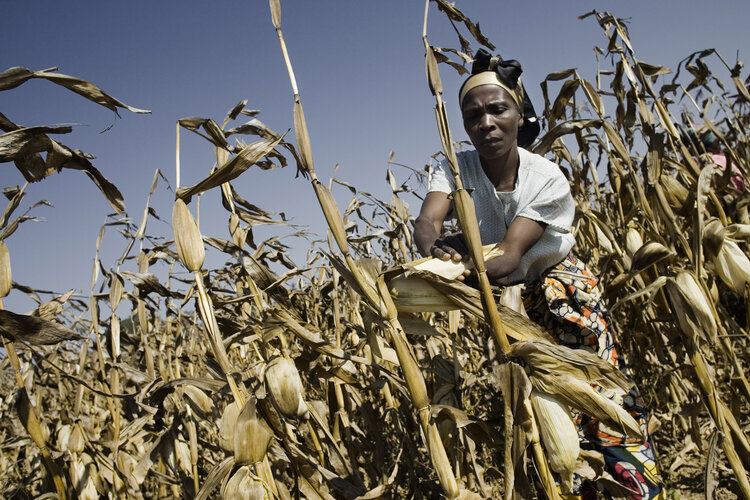
With ESA positioned as a world-class provider of Earth observation data and the United Nations Food and Agriculture Organization (FAO) leading international efforts to defeat hunger, the two organisations have teamed up to exploit their particular fields of expertise to better address major global issues such as food security, and to take further advantage of the digital transformation in agriculture.
Winners presented with ESA-EGU Excellence award
19.4.2021 19:00
The winners of the first ESA-EGU Excellence Award were awarded their prizes earlier today at the virtual EGU General Assembly ceremony, attended by ESA’s Director General, Josef Aschbacher and ESA’s Acting Director of Earth Observation Programmes, Toni Tolker-Nielsen.
Celebrate Earth Day with ESA
19.4.2021 13:05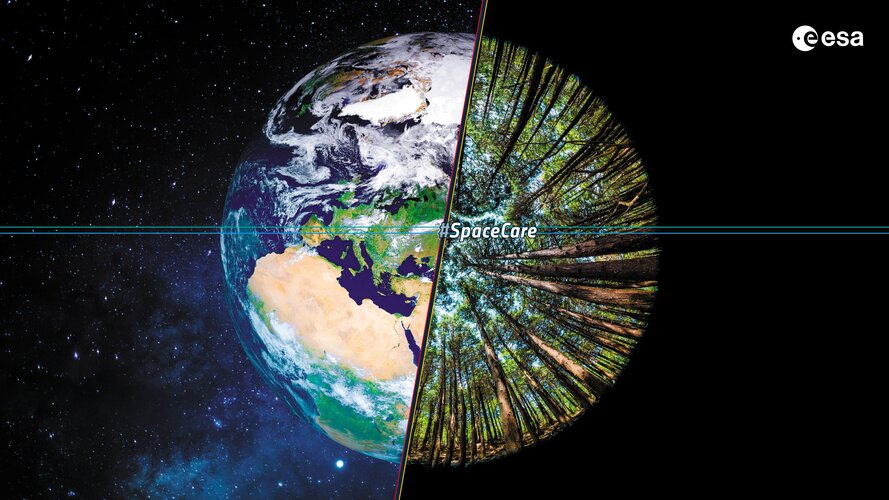
At ESA, every day is Earth Day. As we humans continue to subject our home planet to increasing pressures, we are better placed than ever to understand and monitor the consequences of what we inflict. Astronauts onboard the International Space Station give us the human perspective of how beautiful Earth is, while satellites orbiting above return systematic measures to take the pulse of our planet 24 hours a day.
These measurements allow us to understand how Earth works as a system and how human activity is changing natural processes, leading to climate change. This information is fundamental to global climate policy-making through international bodies such as the Intergovernmental Panel on Climate Change and UN Climate Change Conferences, the next being COP26 later this year.
Celebrate Earth Day with ESA with this compilation of content and activities now available.
La Soufrière volcano: before-and-after
16.4.2021 13:30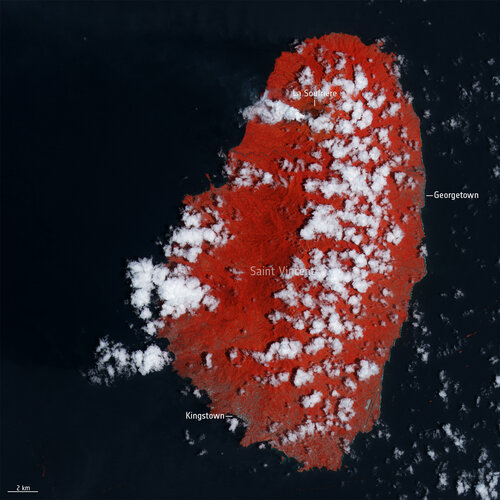 Image:
False-colour images captured by Copernicus Sentinel-2 show the aftermath of the explosive volcanic eruption that took place on 9 April 2021 on the Caribbean island of Saint Vincent.
Image:
False-colour images captured by Copernicus Sentinel-2 show the aftermath of the explosive volcanic eruption that took place on 9 April 2021 on the Caribbean island of Saint Vincent.
Earth from Space: Space Coast, Florida
16.4.2021 10:00
On 22 April 2021, on Earth Day, Thomas Pesquet is planned to return to the International Space Station for his second mission, Alpha. Ahead of his launch, the Copernicus Sentinel-2 mission takes us over Cape Canaveral, USA, in a region known as the Space Coast.
Satellite imagery key to powering Google Earth
15.4.2021 15:00
One of the most comprehensive pictures of our changing planet is now available to the public. Thanks to the close collaboration between Google Earth, ESA, the European Commission, NASA and the US Geological Survey, 24 million satellite photos from the past 37 years have been embedded into a new layer of Google Earth – creating a new, explorable view of time on our planet.
Earth from Space: Bucharest, Romania
9.4.2021 10:00
The Copernicus Sentinel-2 mission takes us over Bucharest – the capital and largest city of Romania.
Earth from Space: Bucharest, Romania
9.4.2021 10:00
The Copernicus Sentinel-2 mission takes us over Bucharest – the capital and largest city of Romania.
Satellites monitor Mount Etna’s unpredictable behaviour
8.4.2021 16:30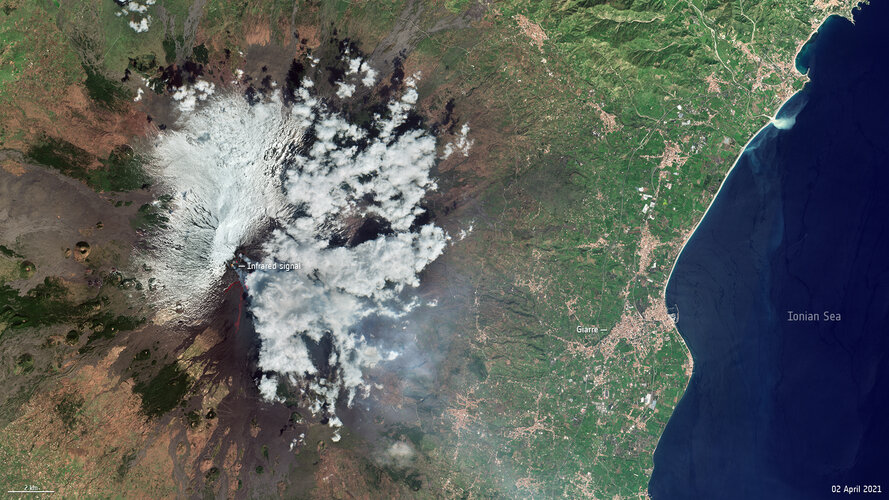
Italy’s Mount Etna, Europe’s most active volcano, has recently been on explosive form, with 17 eruptions in less than three months. Instruments onboard three different satellites orbiting Earth have acquired imagery of the eruptions – revealing the intensity of the lava-fountaining eruptive episodes, known as paroxysms.
Earth from Space: Easter egg hunt
2.4.2021 10:00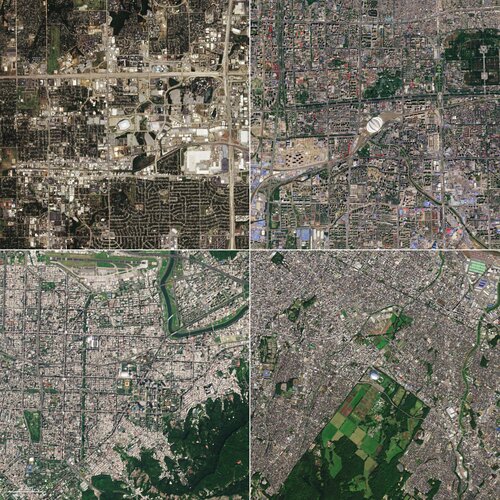
With Easter right around the corner, we take a look at four egg-shaped buildings visible from space as captured by the Copernicus Sentinel-2 mission.
Second Scout gets the go-ahead
30.3.2021 9:55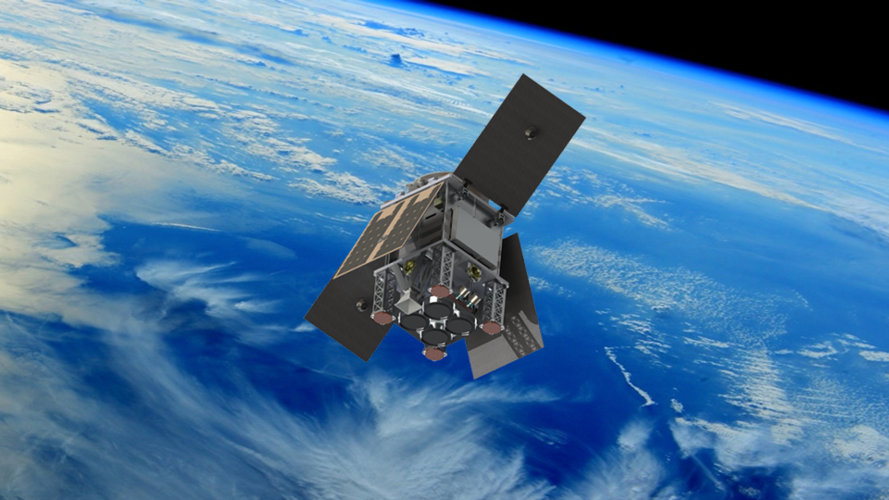
Following the selection of the first Scout satellite mission last December, ESA has also given the greenlight to start negotiations with Surrey Satellite Technology Ltd in the UK to lead the development of the second Scout mission – HydroGNSS.
Measuring shoreline retreat
29.3.2021 11:45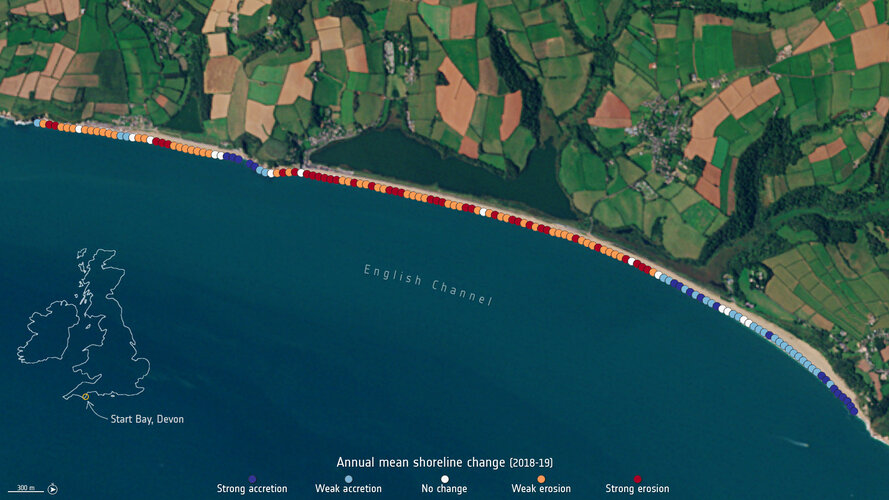
Climate change is having an undeniable influence on coastal areas. A substantial proportion of the world’s sandy coastlines are already eroding owing to increased storm surges, flooding and sea level rise. With our coastal environments in constant change, Earth observation satellites are being used to better strengthen our knowledge of changing coastlines.
Suez Canal traffic jam seen from space
26.3.2021 14:58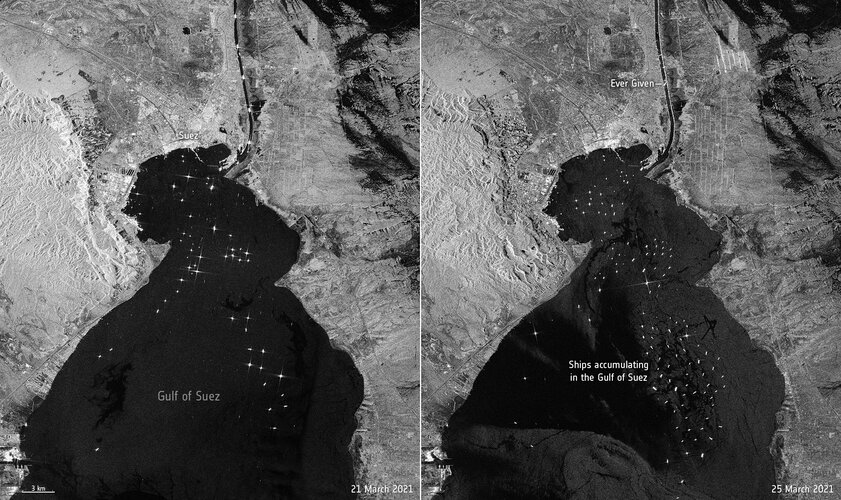 Image:
The enormous Ever Given container ship, wedged in Egypt’s Suez Canal, is visible in new images captured by the Copernicus Sentinel-1 mission.
Image:
The enormous Ever Given container ship, wedged in Egypt’s Suez Canal, is visible in new images captured by the Copernicus Sentinel-1 mission.
ESA–EGU announce Excellence Award winners
26.3.2021 13:30
ESA, along with the European Geosciences Union (EGU), are excited to announce the winners of the first ESA–EGU Earth Observation Excellence Awards.
Earth from Space: Gariep Dam, South Africa
26.3.2021 10:00
The Gariep Dam, the largest dam in South Africa, is featured in this false-colour image captured by the Copernicus Sentinel-2 mission.
Earth from Space: Gariep Dam, South Africa
26.3.2021 10:00
The Gariep Dam, the largest dam in South Africa, is featured in this false-colour image captured by the Copernicus Sentinel-2 mission.
Water mission takes on space weather
24.3.2021 15:20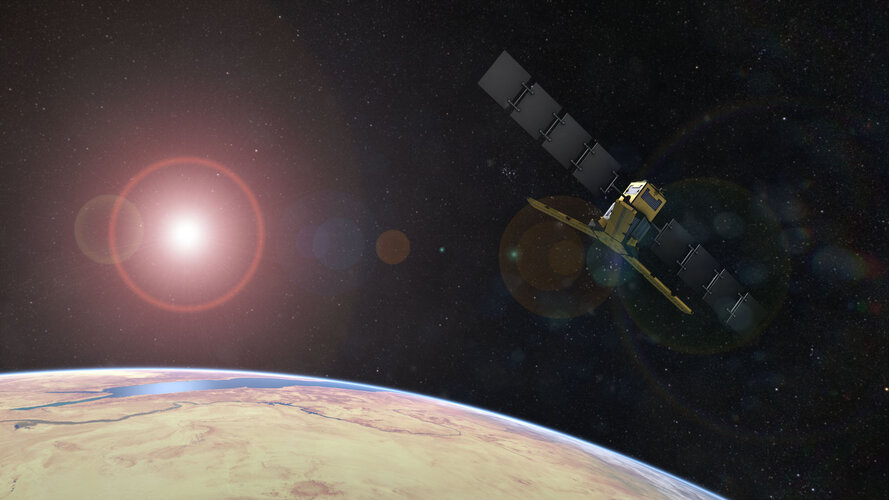
For well over a decade, ESA’s SMOS satellite has been delivering a wealth of data to map moisture in soil and salt in the surface waters of the oceans for a better understanding of the processes driving the water cycle. While addressing key scientific questions, this exceptional Earth Explorer has repeatedly surpassed expectations by returning a wide range of unexpected results, often leading to practical applications that improve everyday life. Adding to SMOS’ list of talents, new findings show that what was considered noise in the mission’s data can actually be used to monitor solar activity and space weather, which can damage communication and navigation systems.
Satellites map record floods in Australia
24.3.2021 11:30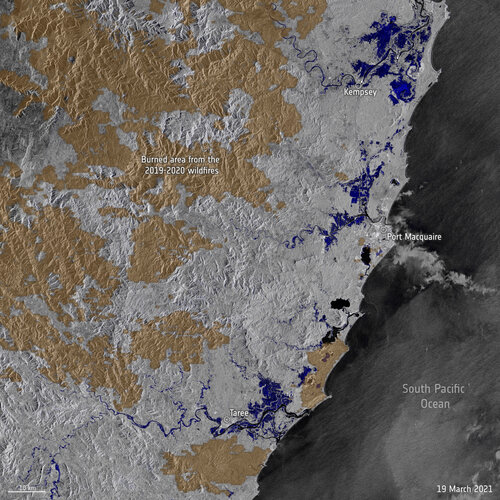 Image:
Stretches of land across New South Wales, Australia, have been hit with torrential rain leading to record-breaking floods. Data from the Copernicus Sentinel-1 mission are being used to map flooded areas to help relief efforts.
Image:
Stretches of land across New South Wales, Australia, have been hit with torrential rain leading to record-breaking floods. Data from the Copernicus Sentinel-1 mission are being used to map flooded areas to help relief efforts.
Vacancy for the post of ESA Director of Earth Observation Programmes
19.3.2021 14:00
The European Space Agency is currently looking for a new Director of Earth Observation Programmes, to join its Executive Board and support the Director General, with responsibility for relevant ESA programmes and overall objectives.
Earth from Space: Amazon rainforest
19.3.2021 10:00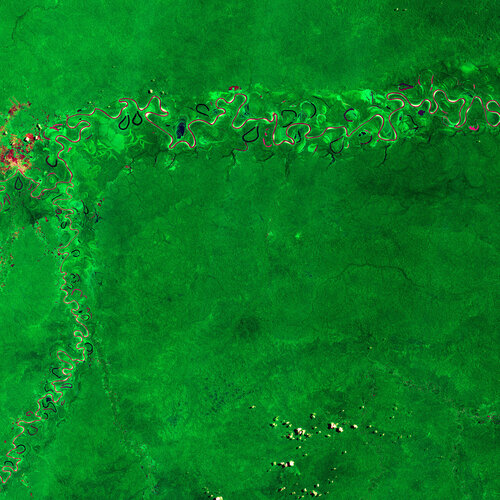
Ahead of the International Day of Forests, the Copernicus Sentinel-2 mission takes us over part of the Amazon rainforest in the Amazonas – the largest state in Brazil.
Earth from Space: Amazon rainforest
19.3.2021 10:00
Ahead of the International Day of Forests, the Copernicus Sentinel-2 mission takes us over part of the Amazon rainforest in the Amazonas – the largest state in Brazil.
Maps to improve forest biomass estimates
17.3.2021 10:00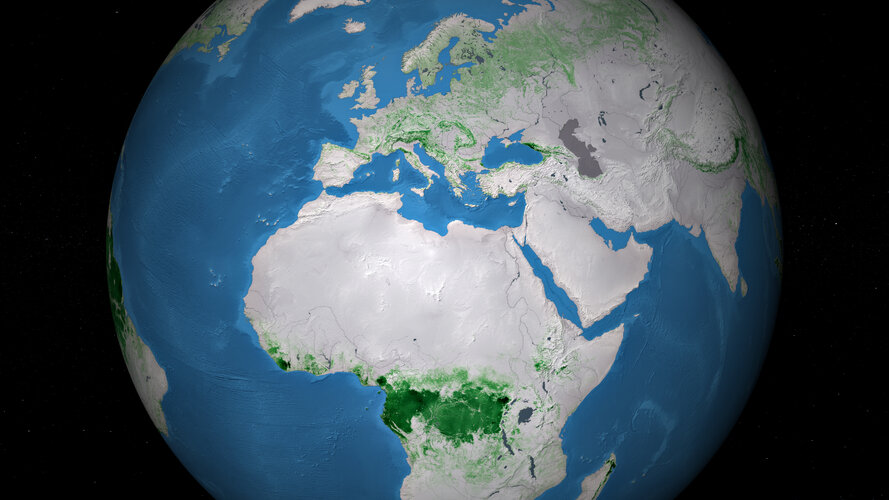
Fluctuations in the carbon-rich biomass held within the world’s forests can contribute to, or slow, climate change. A series of new maps of above ground biomass, generated using space observations, is set to help our understanding of global carbon cycling and support forest management, emissions reduction and sustainable development policy goals.
Air pollution returning to pre-COVID levels
15.3.2021 14:50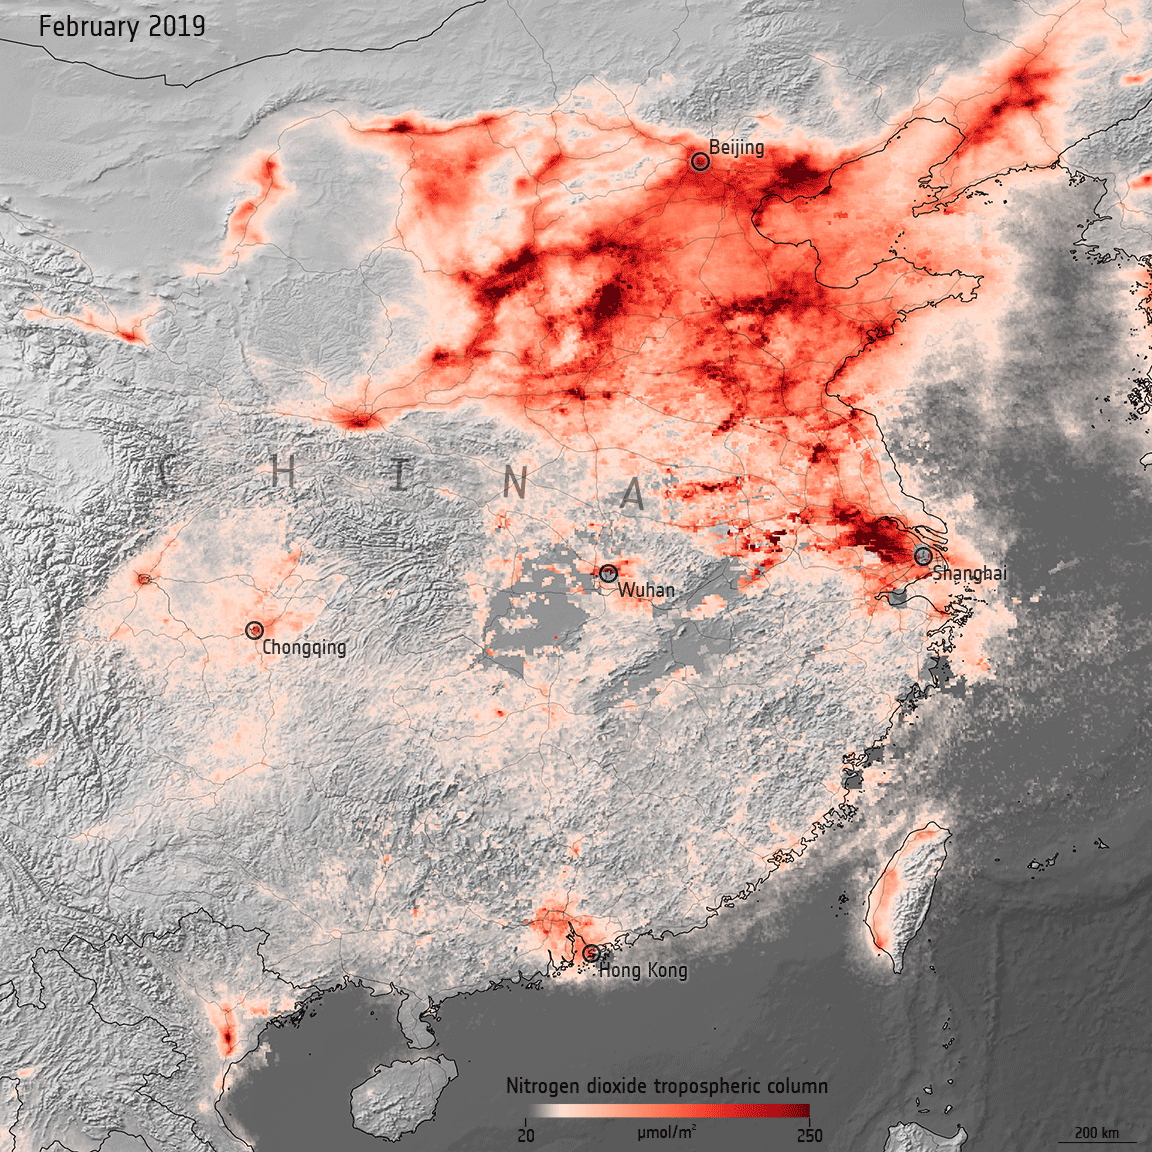
In early 2020, data from satellites were used to show a decline in air pollution coinciding with nationwide lockdowns put in place to stop the spread of COVID-19. One year later, as lockdown restrictions loosen in some countries and regular activity resumes, nitrogen dioxide levels are bouncing back to pre-COVID levels.
Earth from Space: Strait of Gibraltar
12.3.2021 10:00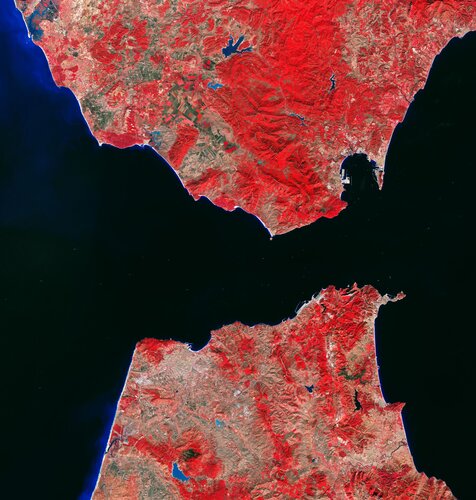
The Strait of Gibraltar is featured in this false-colour image captured by the Copernicus Sentinel-2 mission.
Earth from Space: Strait of Gibraltar
12.3.2021 10:00
The Strait of Gibraltar is featured in this false-colour image captured by the Copernicus Sentinel-2 mission.
Earth from Space: Strait of Gibraltar
12.3.2021 10:00
The Strait of Gibraltar is featured in this false-colour image captured by the Copernicus Sentinel-2 mission.
Gravity mission still unearthing hidden secrets
11.3.2021 14:40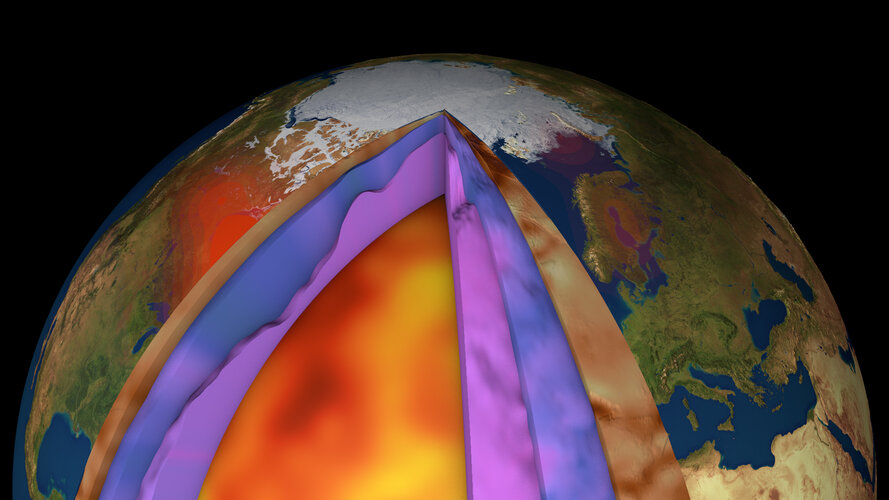
Despite ESA’s GOCE mission ending over seven years ago, scientists continue to use this remarkable satellite’s gravity data to delve deep and unearth secrets about our planet. Recent research shows how scientists have combined GOCE data with measurements taken at the surface to generate a new model of Earth’s crust and upper mantle. This is the first time such a model has been created this way – and it is shedding new light on processes of plate tectonics, which, in turn, are related to phenomena such as earthquakes and volcanic eruptions.
Antarctica’s magnetic link to ancient neighbours
9.3.2021 14:47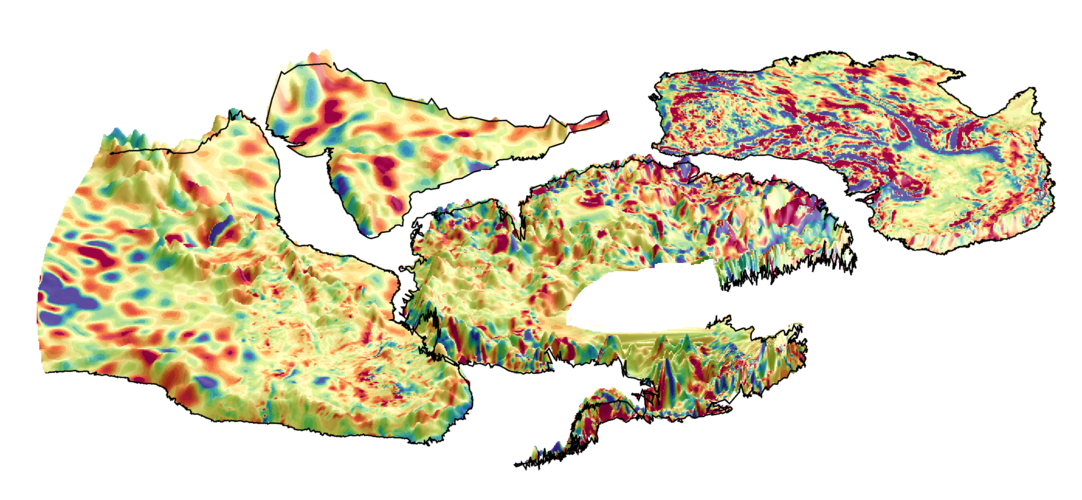
For the first time, an international team of scientists has used magnetic data from ESA’s Swarm satellite mission together with aeromagnetic data to help reveal the mysteries of the geology hidden beneath Antarctica’s kilometres-thick ice sheets, and link Antarctica better to its former neighbours.
Contract signed to build Arctic weather satellite
9.3.2021 9:35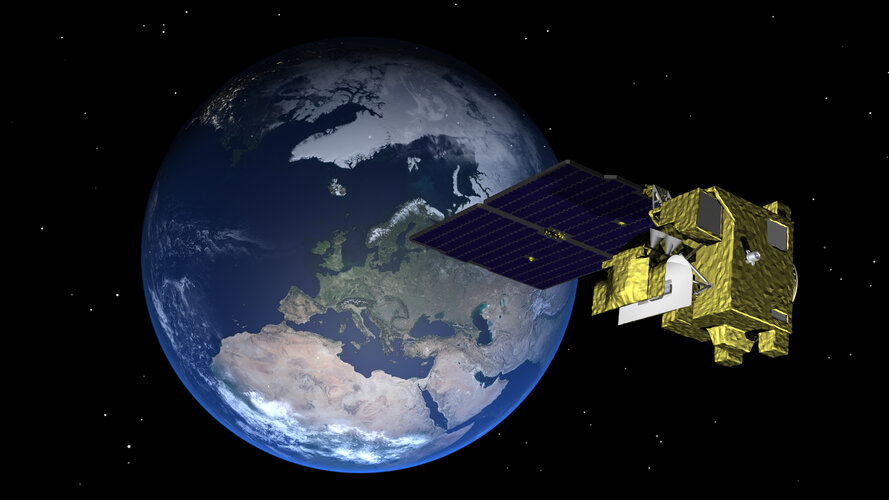
With the need for satellite data to be received more frequently for faster weather forecasting updates in the Arctic, ESA has signed a contract with OHB Sweden to a build prototype satellite for the Arctic Weather Satellite mission.
Contract signed to build Arctic weather satellite
9.3.2021 9:35
With the need for satellite data to be received more frequently for faster weather forecasting updates in the Arctic, ESA has signed a contract with OHB Sweden to a build prototype satellite for the Arctic Weather Satellite mission.
Earth from Space: Galápagos Islands
5.3.2021 10:00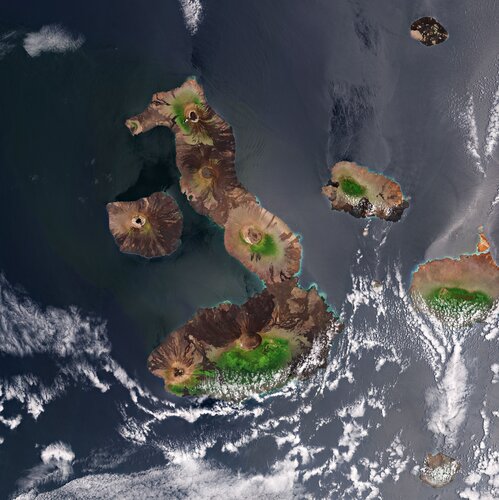
The Copernicus Sentinel-2 mission takes us over the Galápagos Islands – a volcanic archipelago situated some 1000 km west of Ecuador in the Pacific Ocean.
Earth from Space: Galápagos Islands
5.3.2021 10:00
The Copernicus Sentinel-2 mission takes us over the Galápagos Islands – a volcanic archipelago situated some 1000 km west of Ecuador in the Pacific Ocean.
Monitoring methane emissions from gas pipelines
4.3.2021 10:00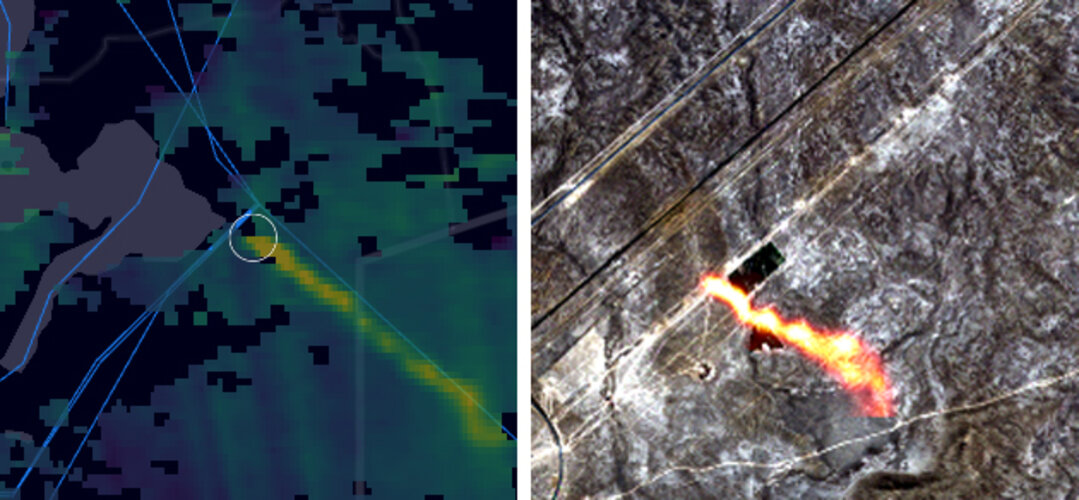
For the first time, scientists, using satellite data from the Copernicus Sentinel missions, are now able to detect individual methane plumes leaking from natural gas pipelines around the globe.
Space in response to COVID-19
3.3.2021 9:00
Do you have fresh ideas on how Earth observation data can contribute to monitoring the effects brought on by the COVID-19 pandemic? If so, ESA and the European Commission have launched a new series of monthly challenges asking for innovative solutions on how satellite data can be used to help better understand the effects of the coronavirus on society, economy and the environment.
Giant iceberg breaks off Brunt Ice Shelf in Antarctica
2.3.2021 10:00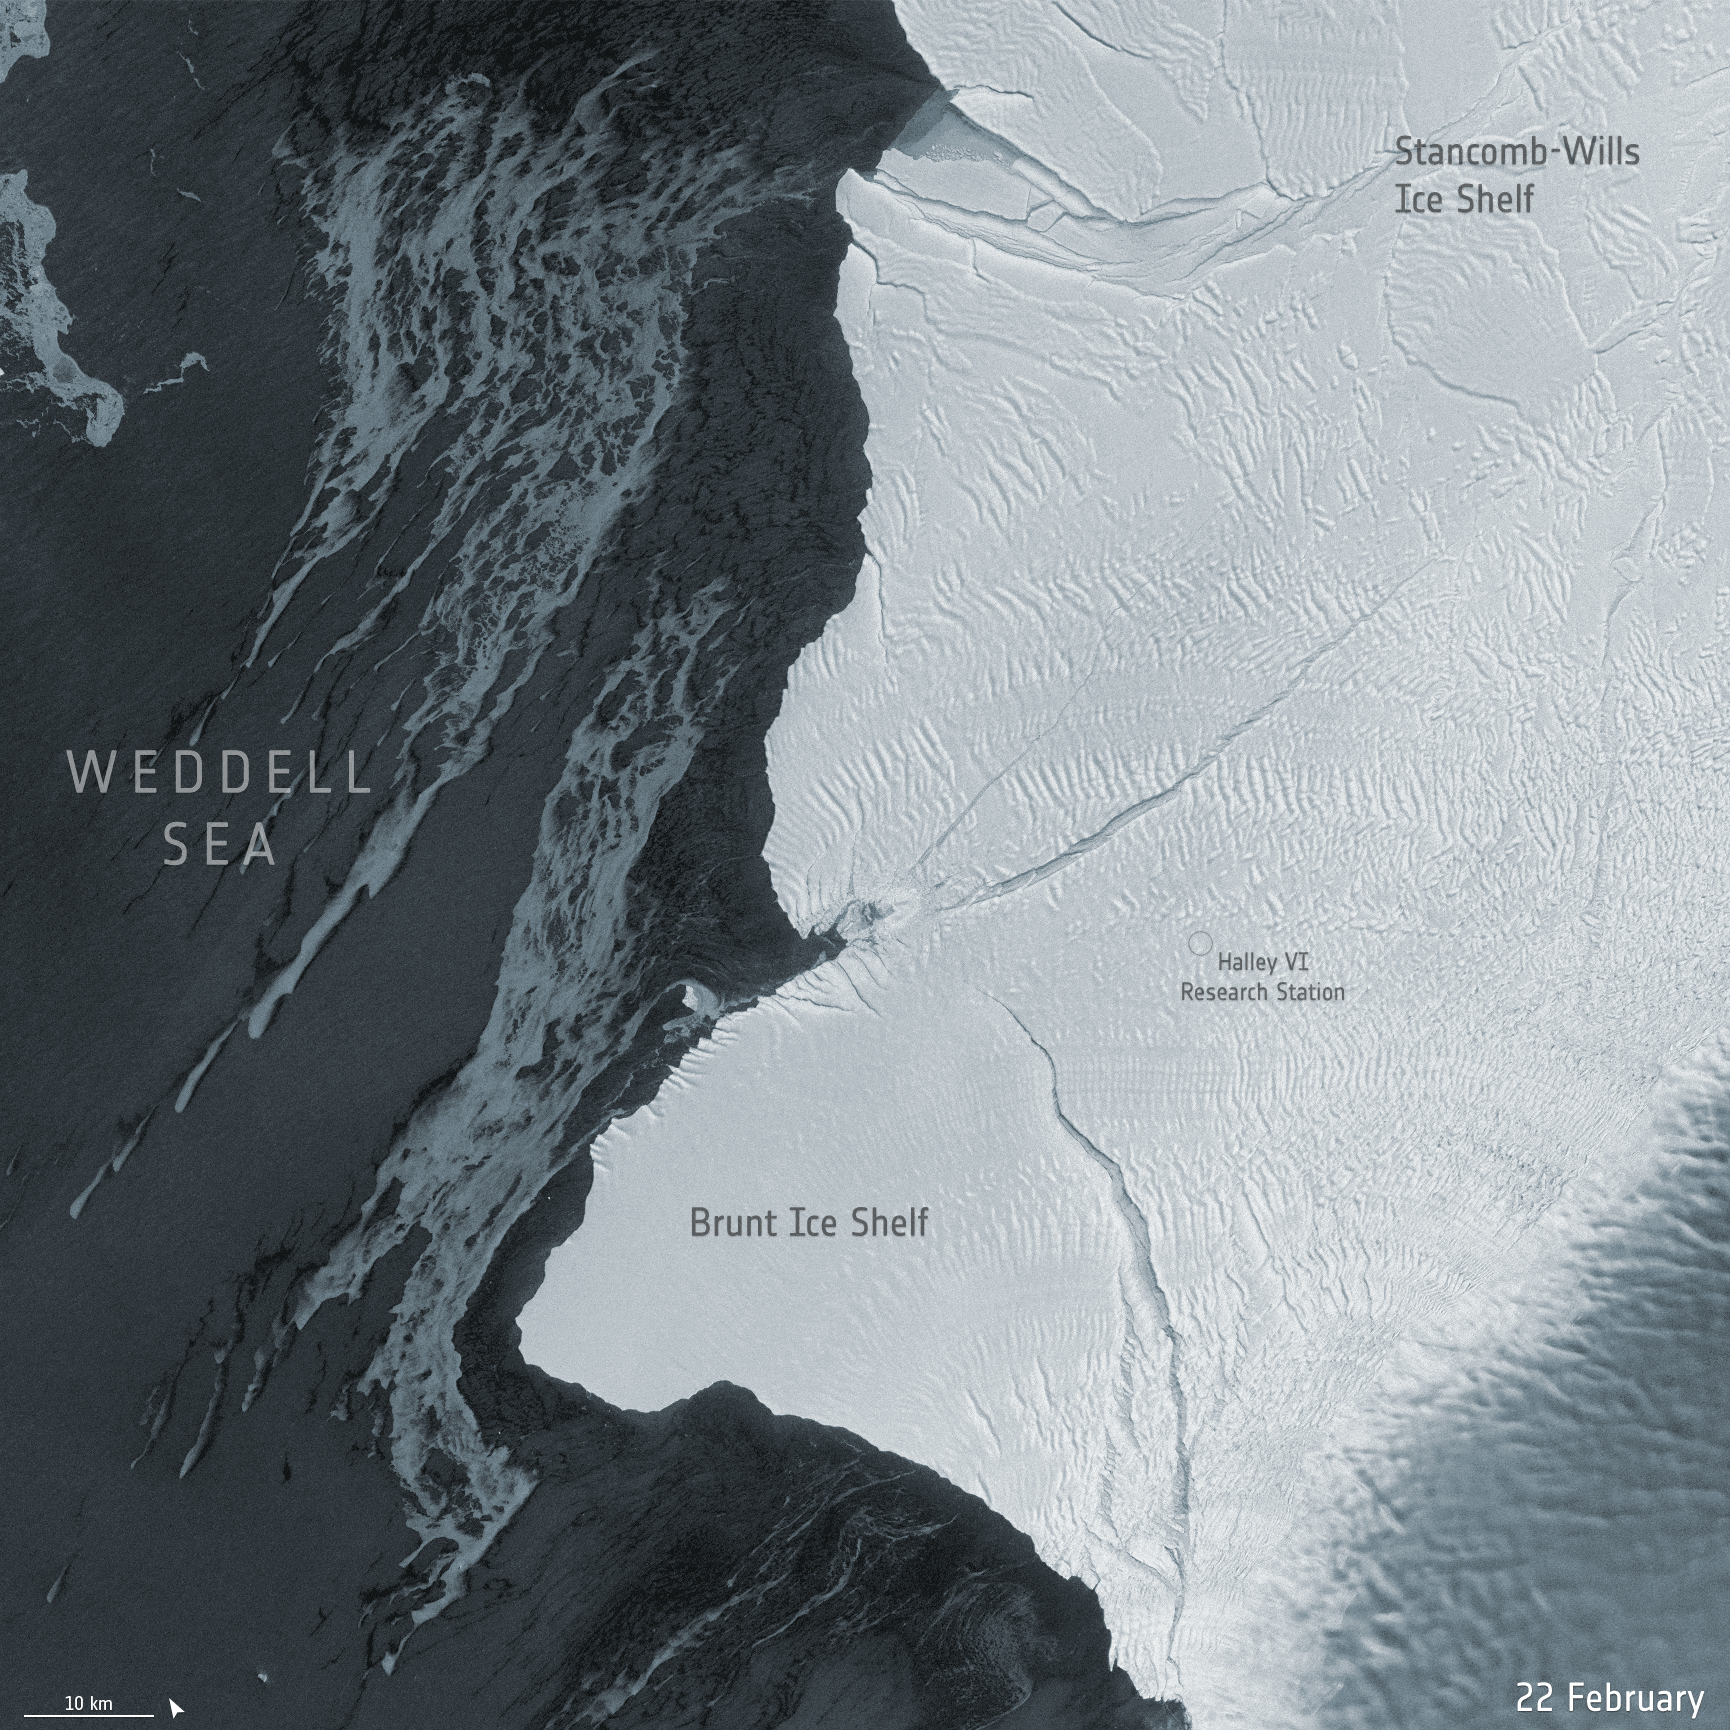 Image:
New Copernicus Sentinel-1 radar images show a giant iceberg breaking off from the northern section of Antarctica’s Brunt Ice Shelf
Image:
New Copernicus Sentinel-1 radar images show a giant iceberg breaking off from the northern section of Antarctica’s Brunt Ice Shelf
Earth from Space: Vancouver
26.2.2021 10:00
The Copernicus Sentinel-2 mission takes us over Vancouver – the third largest city in Canada.
Earth from Space: Vancouver
26.2.2021 10:00
The Copernicus Sentinel-2 mission takes us over Vancouver – the third largest city in Canada.
ESA moves forward with Harmony
23.2.2021 16:40
Following the selection of three Earth Explorer candidate missions to enter a first feasibility study in September 2018, ESA has chosen one of the candidates, Harmony, to move to the next phase of development. Harmony is envisaged as a mission with two satellites that orbit in formation with one of the Copernicus Sentinel-1 satellites to address key scientific questions related to ocean, ice and land dynamics.
Getz on the run
23.2.2021 11:11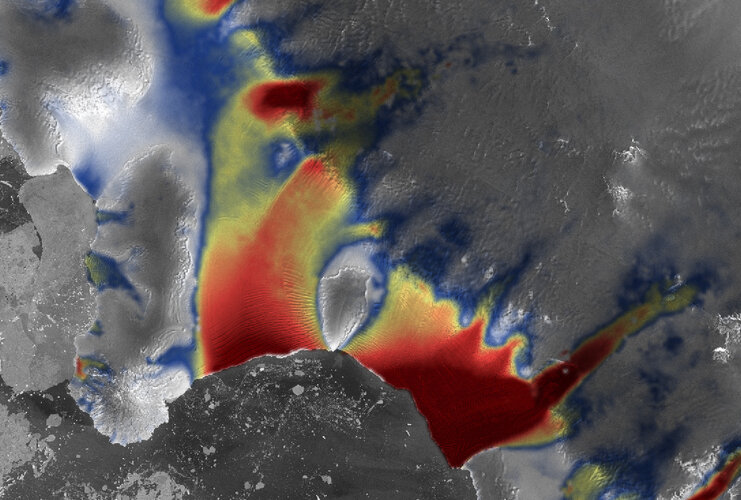
Using a 25-year record of satellite observations over the Getz region in West Antarctica, scientists have discovered that the pace at which glaciers flow towards the ocean is accelerating. This new research, which includes data from the Copernicus Sentinel-1 mission and ESA’s CryoSat mission, will help determine if these glaciers could collapse in the next few decades and how this would affect future global sea-level rise.
Satellite radar interferometry effective for mapping crops
19.2.2021 15:38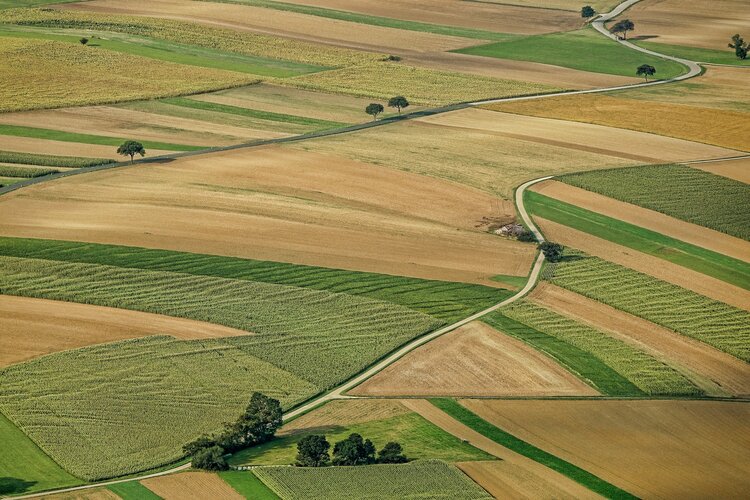
Traditionally, optical, or ‘camera-like’, satellite images are used to map different crops from space, but a recent study shows that Copernicus Sentinel-1 radar data along with interferometric processing can make crop-type mapping even better. This, in turn, will help improve crop-yield forecasts, production statistics, drought and storm damage assessments, and more.
Etna erupts
19.2.2021 13:42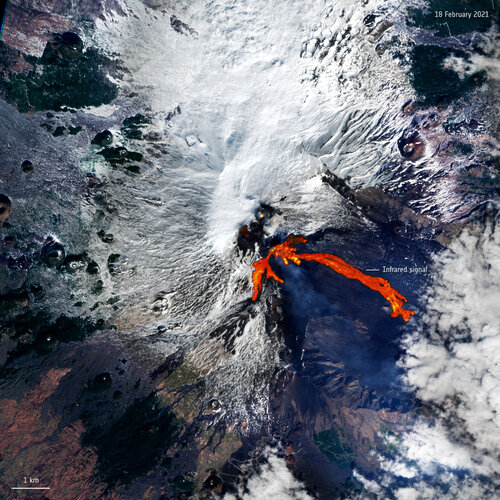 Image:
Italy’s Mount Etna, one of the world’s most active volcanoes, has erupted twice in less than 48 hours, spewing a fountain of lava and ash into the sky. This Copernicus Sentinel-2 image has been processed to show the lava flow in bright red.
Image:
Italy’s Mount Etna, one of the world’s most active volcanoes, has erupted twice in less than 48 hours, spewing a fountain of lava and ash into the sky. This Copernicus Sentinel-2 image has been processed to show the lava flow in bright red.
Earth from Space: Lusaka, Zambia
19.2.2021 10:00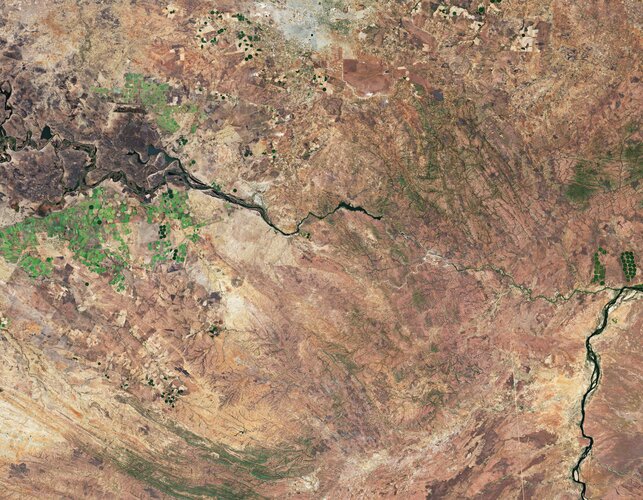
The Copernicus Sentinel-2 mission takes us over Lusaka – the capital and largest city of Zambia.
Earth from Space: Lusaka, Zambia
19.2.2021 10:00
The Copernicus Sentinel-2 mission takes us over Lusaka – the capital and largest city of Zambia.
ESA’s InCubed co-funds new Belgian mission
16.2.2021 16:00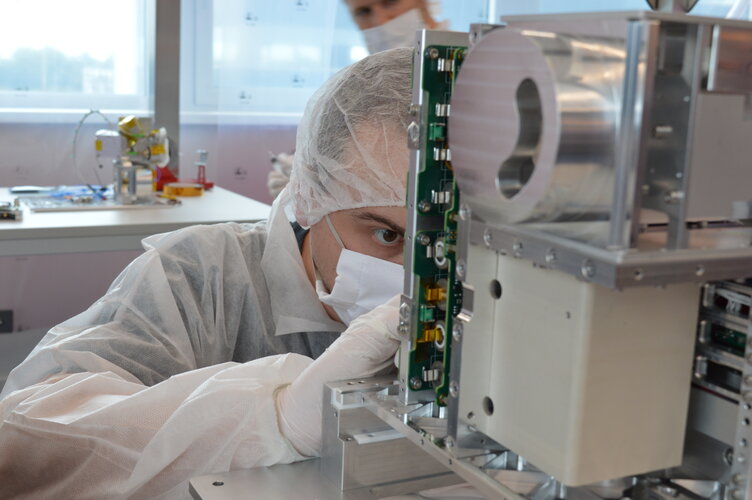 Image:
A contract signed today secures ESA InCubed co-funding towards the development of Aerospacelab’s Multispectral Companion Mission
Image:
A contract signed today secures ESA InCubed co-funding towards the development of Aerospacelab’s Multispectral Companion Mission
Is Brunt on the brink?
12.2.2021 12:15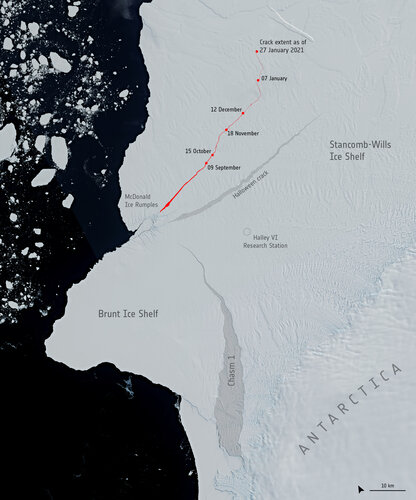
In early 2019, all eyes were fixed on the Brunt Ice Shelf in Antarctica, where a massive iceberg, around the size of Greater London, appeared poised to break off. Almost two years later, the berg is desperately clinging on, although current data indicate calving is imminent. A new crack, spotted in images captured by the Copernicus Sentinel missions, now suggests the potential for calving of multiple bergs.
Earth from Space: Valentine Island
12.2.2021 10:00
For Valentine’s Day, the Copernicus Sentinel-2 mission takes us over Valentine Island in northern Western Australia.
Earth from Space: Valentine Island
12.2.2021 10:00
For Valentine’s Day, the Copernicus Sentinel-2 mission takes us over Valentine Island in northern Western Australia.
Netherlands in white
11.2.2021 16:55 Image:
As this Copernicus Sentinel-3 image captured today shows, the Netherlands remains pretty much snow-covered thanks to days of sub-zero temperatures following the country’s first major snowstorm in a decade.
Image:
As this Copernicus Sentinel-3 image captured today shows, the Netherlands remains pretty much snow-covered thanks to days of sub-zero temperatures following the country’s first major snowstorm in a decade.
Sentinel-6 passes in-orbit tests with flying colours
8.2.2021 15:00In November 2020, the Copernicus Sentinel-6 Michael Freilich satellite was launched into orbit from the Vandenberg Air Force Base in California, US. Now, months later, the satellite has successfully passed what is known as the ‘in-orbit verification phase’, where its equipment is switched on and the instruments’ performance is checked.
Earth from Space: Japan in bloom
5.2.2021 10:00
The Copernicus Sentinel-2 mission takes us over the algal blooms swirling around the Pacific Ocean, just off the coast of Japan.
Earth from Space: Japan in bloom
5.2.2021 10:00
The Copernicus Sentinel-2 mission takes us over the algal blooms swirling around the Pacific Ocean, just off the coast of Japan.
Aeolus shines a light on polar vortex
4.2.2021 11:45
As this winter’s polar vortex currently sends extreme icy blasts of Arctic weather to some parts of the northern hemisphere such as the northeast of the US, scientists are using wind information from ESA’s Aeolus satellite to shed more light on this complex phenomenon.
Is this the end of the A-68A iceberg?
3.2.2021 12:05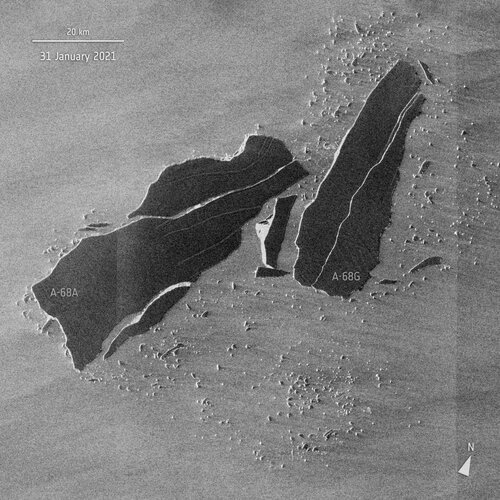
Satellite images have revealed that the once colossal A-68A iceberg has had yet another shattering experience. Several large cracks were spotted in the berg last week and it has since broken into multiple pieces. These little icebergs could indicate the end of A-68A’s environmental threat to South Georgia.
Satellite observations prove crucial in new climate science report
2.2.2021 15:15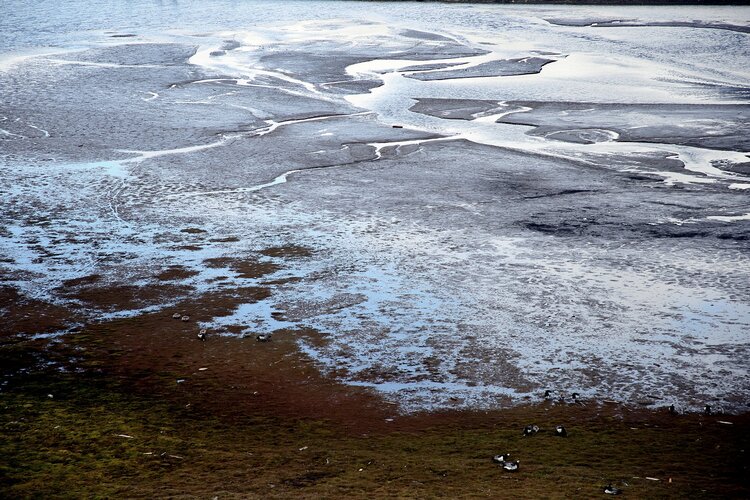
With impacts from climate change threatening major disruption to society in the coming years, leading scientists have released a compilation of the 10 most important insights on climate to help inform collective action on the ongoing climate crisis, in which satellites have played a crucial role in aiding scientific understanding.
Earth observation vital in monitoring wetland waters
2.2.2021 9:00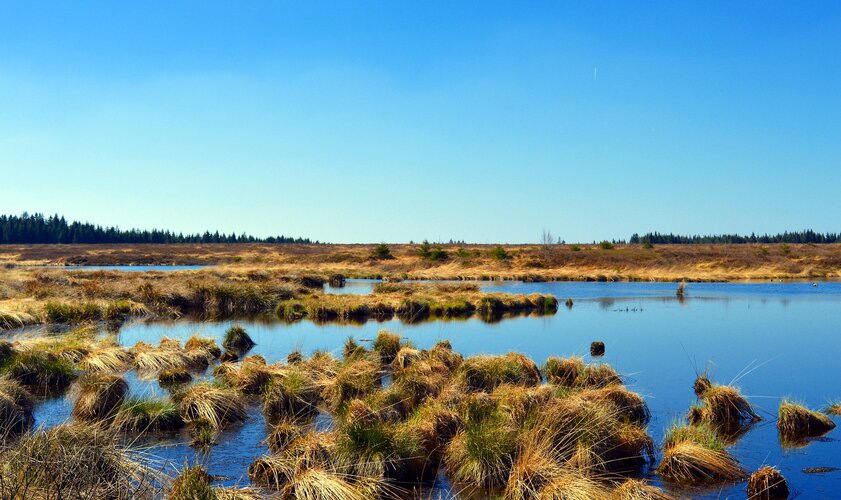
Celebrated annually on 2 February, World Wetlands Day aims to raise global awareness about the importance of wetlands for our planet. This year’s theme shines a light on wetlands as a source of freshwater and encourages actions to restore them. From their vantage point of 800 km high, Earth-observing satellites provide data and imagery on wetlands that can be used to monitor and manage these precious resources sustainably.
Earth from Space: Lake Titicaca
29.1.2021 10:00
Ahead of World Wetlands Day, the Copernicus Sentinel-2 mission takes us over Lake Titicaca – one of the largest lakes in South America.
Earth from Space: Lake Titicaca
29.1.2021 10:00
Ahead of World Wetlands Day, the Copernicus Sentinel-2 mission takes us over Lake Titicaca – one of the largest lakes in South America.
Mapped by Sentinel-1 for Vendée Globe safety
28.1.2021 9:20 Image:
Competitors of the Vendée Globe sailing race are now nearing the finishing point, but while they were near the treacherous iceberg-infested waters of the Southern Ocean they remained relatively safe thanks to satellite observations.
Image:
Competitors of the Vendée Globe sailing race are now nearing the finishing point, but while they were near the treacherous iceberg-infested waters of the Southern Ocean they remained relatively safe thanks to satellite observations.