


zprávy
zdroje zpráv:CoreLogic Reports December Home Prices Increased by 4% Year Over Year
4.2.2020 16:39 GISCafe.com Webcasts-Webinars The CoreLogic HPI Forecast projects U.S. price index will rise 5.2% by December 2020Price gains varied significantly across states last December, …
Nearmap Brings Precise Roof Geometry Measurement to Your Fingertips Through API Integration
4.2.2020 16:39 GISCafe.com Webcasts-Webinars DALLAS, Feb. 04, 2020 (GLOBE NEWSWIRE) -- Nearmap, a company that delivers high-resolution aerial imagery as a service to businesses across the …TraceAir Will Showcase New Site Work Estimating Tool at CONEXPO 2020
4.2.2020 16:39 GISCafe.com Webcasts-Webinars A novel tool will help grading contractors to run more accurate takeoffs and get precise quantities based on bid documentsREDWOOD CITY, Calif., Feb. …
vHive Launches New AI Driven Capabilities to Accelerate Tower Inspections for Enterprises Worldwide
4.2.2020 16:39 GISCafe.com Webcasts-Webinars HERZLIYA, Israel, Feb. 4, 2020 — (PRNewswire) — vHive, the only software solution that enables enterprises to digitize their field …Industry support for South East Asia's inaugural geospatial show & conference builds momentum
4.2.2020 9:35 GISCafe.com Webcasts-Webinars Airbus and Hexagon join Trimble as sponsors, with notable speakers including Dr Vivian Balakrishnan, representatives from the World Bank, Grab, and …Představujeme nový Corpis Maps Portal a Corpis Maps Studio!
4.2.2020 9:20 T-MAPYThe post Představujeme nový Corpis Maps Portal a Corpis Maps Studio! appeared first on T-MAPY spol. s r.o..
URISA Announces 2020 Vanguard Cabinet of Young Professionals
4.2.2020 9:00 GISCafe.com Webcasts-Webinars Des Plaines, IL (February 3, 2020) URISA is pleased to announce the newest members of its Vanguard Cabinet. The Vanguard Cabinet (VC) …GISáček 2020 (pozvánka)
4.2.2020 8:47 GISportal.cz
Tradiční konference GISáček (18. března 2020) je určená studentům vysokých škol, kteří zde mají možnost prezentovat výsledky svých odborných studentských prací. Stejně jako v předchozích letech bude konference součástí Sympozia GIS Ostrava 2020, které bude probíhat ve dnech 18.3.-20.3.2020. Všichni aktivní účastnici se mohou zdarma tohoto sympozia zúčastnit. Program Jako vždy bude i letos konference otevřená pro všechny studenty […]
The post GISáček 2020 (pozvánka) appeared first on GISportal.cz.
Biotop vybraných zvláště chráněných druhů velkých savců
4.2.2020 1:00 Cenia - Katalog metadat ČR - INSPIRE Biotop vybraných zvláště chráněných druhů velkých savcůGeospatial Analytics Safety InSite™ Delivers Powerful Safety Management Solution for Real Estate Portfolios
4.2.2020 0:34 GISCafe.com Webcasts-Webinars SCOTTSDALE, Ariz., Feb. 3, 2020 — (PRNewswire) — Geospatial Analytics®, a real estate software developer, announced a new release of …Fortem Technologies Wins Contract From Department of Defense for Advanced Airspace Security and Defense System
4.2.2020 0:34 GISCafe.com Webcasts-Webinars AI-powered detection and mitigation solutions selected to support Defense Innovation Unit's charter to counter improvised threatsPLEASANT GROVE, …
Geospatial Data for Social Change: A New Initiative is Announced by NLT and CEGA
3.2.2020 17:46 GISCafe.com Webcasts-Webinars New Light Technologies (NLT) and The Center for Effective Global Action (CEGA), based at the University of California, Berkeley, are teaming up to …Intermap Technologies Reports Preliminary 2019 Financial Results; Sharpened Focus on Government Contracting; and Director Resignation
3.2.2020 17:45 GISCafe.com Webcasts-Webinars DENVER, Jan. 31, 2020 — (PRNewswire) — Intermap Technologies today announced preliminary unaudited financial results for the year ended …Quantum Announces Agreement to Acquire Western Digital's ActiveScale Business
3.2.2020 17:45 GISCafe.com Webcasts-Webinars ActiveScale Object Storage Product Line Bolsters Quantum's Industry-Leading Portfolio for Managing Video and Unstructured DataSAN JOSE, Calif., Feb. …
Maxar Technologies Will Build Next-Generation Intelsat Epic Geostationary Communications Satellite with NASA Hosted Payload
3.2.2020 17:45 GISCafe.com Webcasts-Webinars WESTMINSTER, Colo. & MCLEAN, Va. — (BUSINESS WIRE) — February 3, 2020 —Intelsat (NYSE: I) has selected Maxar Technologies …
EagleView Unveils New EagleView Edge™ Program
3.2.2020 17:45 GISCafe.com Webcasts-Webinars Partner program to fuel data-driven workflow solutions for the construction industryBELLEVUE, Wash., Feb. 3, 2020 — (PRNewswire) — …
Fortem Technologies Announces Complete End to End C-UAS Solution
3.2.2020 17:45 GISCafe.com Webcasts-Webinars New addition to TrueView family of radar, R30, solves industry's mid-range radar challenges for comprehensive airspace security and defensePLEASANT …
Loveland Innovations Delivers First-Ever AI-Driven Damage Detection Tool for Hand-held Property Inspections
3.2.2020 17:45 GISCafe.com Webcasts-Webinars PLEASANT GROVE, Utah, Feb. 3, 2020 — (PRNewswire) — Loveland Innovations®, maker of advanced data analytics solutions, today released a …Oblasti se zhoršenou kvalitou ovzduší
3.2.2020 16:20 Středočeský kraj V mapové aplikaci Oblasti se zhoršenou kvalitou ovzduší byla přidána aktuální data 5letý průměr 2014–2018 a roční koncentrace za rok 2018.. Aktualizace byla provedena na základě nových údajů ČHMÚ.20200205 - volné místo - Odborný referent v oddělení právních vztahů KP Rumburk na KÚ pro ÚK
3.2.2020 15:23 ČÚZK /Urady/Katastralni-urady/Katastralni-urady/Katastralni-urad-pro-Ustecky-kraj/Katastralni-pracoviste/KP-Rumburk/O-uradu/Aktuality/20200203-volne-misto-Odborny-referent-v-oddele20200205 - volné místo - Odborný referent v oddělení právních vztahů KP Rumburk na KÚ pro ÚK
3.2.2020 15:23 ČÚZK - předpisy a opatření Katastrální úřad pro Ústecký kraj - Katastrální pracoviště Rumburk zveřejnil novou aktualitu: Nabídka volného pracovního místa - Odborný referent v oddělení právních vztahů k nemovitostem Katastrálního pracoviště Rumburk na Katastrálním úřadu pro Ústecký kraj20200205 - volné místo - Odborný referent v oddělení právních vztahů KP Rumburk na KÚ pro ÚK
3.2.2020 15:22 ČÚZK - předpisy a opatření Katastrální úřad pro Ústecký kraj - Katastrální pracoviště Rumburk zveřejnil novou aktualitu: Nabídka volného pracovního místa - Odborný referent v oddělení právních vztahů k nemovitostem Katastrálního pracoviště Rumburk na Katastrálním úřadu pro Ústecký kraj20200205 - volné místo - Odborný referent v oddělení právních vztahů KP Rumburk na KÚ pro ÚK
3.2.2020 15:22 ČÚZK /Urady/Katastralni-urady/Katastralni-urady/Katastralni-urad-pro-Ustecky-kraj/O-uradu/Aktuality/20200203-volne-misto-Odborny-referent-v-oddeleOdborný referent v oddělení právních vztahů k nemovitostem Katastrálního pracoviště Rumburk na Katas
3.2.2020 15:15 ČÚZK /Urady/Katastralni-urady/Katastralni-urady/Katastralni-urad-pro-Ustecky-kraj/Uredni-deska/Oznameni-a-jina-uredni-sdeleni/Volna-mista/DMS/Odborny-referent-v-oddeleni-pravnich-vztahu-k-nemoOdborný referent v oddělení právních vztahů k nemovitostem Katastrálního pracoviště Rumburk na Katas
3.2.2020 15:15 ČÚZK - volná místa Katastrální úřad pro Ústecký kraj Katastrální pracoviště Rumburk vypisuje výběrové řízení na místo Odborný referent v oddělení právních vztahů k nemovitostem Katastrálního pracoviště Rumburk na KatasOdborný referent v oddělení právních vztahů k nemovitostem Katastrálního pracoviště Rumburk na Katas
3.2.2020 15:15 ČÚZK - předpisy a opatření Katastrální úřad pro Ústecký kraj Katastrální pracoviště Rumburkvypisuje výběrové řízení na místo
Odborný referent v oddělení právních vztahů k nemovitostem Katastrálního pracoviště Rumburk na Katastrálním úřadu pro Ústecký kraj
Simcenter 3D rozšiřuje možnosti multidisciplinárních simulací
3.2.2020 11:48 Konstruktér Simcenter 3D podporuje multidisciplinární simulace z centrálního konstrukčního prostředí, které umožňují predikovat reálné chování mnoha fyzikálních [...]Rozpočet úřadu za rok 2020
3.2.2020 11:47 ČÚZK /Urady/Zememericke-a-katastralni-inspektoraty/Zememericke-a-katastralni-inspektoraty/Zememericky-a-katastralni-inspektorat-v-Plzni/Rozpocet/Rozpocet-uradu-za-rok-2020Rozpočet úřadu za rok 2020
3.2.2020 11:47 ČÚZK - předpisy a opatření Zeměměřický a katastrální inspektorát v Plznivystavuje rozpočet úřadu za rok
2020
Výroční souhrnná resortní zpráva za rok 2019
3.2.2020 10:50 ČÚZK - předpisy a opatření Katastrální úřad pro Liberecký krajvydává výroční zprávu úřadu za rok
2019
TT assistant prof position in Finland
3.2.2020 10:43 Aalto University in Finland is looking for a TT assistant professor in geoinformation technology:https://www.aalto.fi/en/open-positions/tenure-track-assistant-professor-in-geoinformation-technologyvrchní referent/rada – investiční referent
3.2.2020 10:33 ČÚZK /Urady/Katastralni-urady/Katastralni-urady/Katastralni-urad-pro-hlavni-mesto-Prahu/Uredni-deska/Oznameni-a-jina-uredni-sdeleni/Volna-mista/DMS/vrchni-referent-rada-–-investicni-referentvrchní referent/rada – investiční referent
3.2.2020 10:33 ČÚZK - předpisy a opatření Katastrální úřad pro hlavní město Prahu - Katastrální pracoviště Prahavypisuje výběrové řízení na místo
vrchní referent/rada – investiční referent
vrchní referent/rada – investiční referent
3.2.2020 10:33 ČÚZK - volná místa Katastrální úřad pro hlavní město Prahu - Katastrální pracoviště Praha vypisuje výběrové řízení na místo vrchní referent/rada – investiční referentSTOP-STAV v k.ú. Vyskeř
3.2.2020 10:27 ČÚZK - předpisy a opatření Katastrální úřad pro Liberecký kraj - Katastrální pracoviště Semily zveřejnil novou aktualitu: Dne 3. 2. 2020 byl na části k.ú. Vyskeř vyhlášen STOP-STAV pro všechny zápisy do katastru (vklady a záznamy) a rezervace nových parcelních čísel do doby zplatnění obnoveného katastrálního operátu mapováním.Geodetickou veřejnost tímto upozorňujeme na nemožnost rezervace nových parcelních čísel a žádáme je, aby danému STOP-STAVU přizpůsobili plánované, nebo rozpracované zakázky v tomto k.ú..
STOP-STAV v k.ú. Vyskeř
3.2.2020 10:27 ČÚZK - předpisy a opatření Katastrální úřad pro Liberecký kraj - Katastrální pracoviště Semily zveřejnil novou aktualitu: Dne 3. 2. 2020 byl v k.ú. Vyskeř vyhlášen STOP-STAV pro všechny zápisy do katastru (vklady a záznamy) a rezervace nových parcelních čísel do doby zplatnění obnoveného katastrálního operátu mapováním.Geodetickou veřejnost tímto upozorňujeme na nemožnost rezervace nových parcelních čísel a žádáme je, aby danému STOP-STAVU přizpůsobili plánované, nebo rozpracované zakázky v tomto k.ú..
STOP-STAV v k.ú. Vyskeř
3.2.2020 10:27 ČÚZK /Urady/Katastralni-urady/Katastralni-urady/Katastralni-urad-pro-Liberecky-kraj/Katastralni-pracoviste/KP-Semily/O-uradu/Aktuality/STOP-STAV-v-k-u-Vysker20200203 - volné místo - Vedoucí OMaK v kanceláři ředitele katastrálního úřadu na KÚ pro Ústecký kra
3.2.2020 9:52 ČÚZK - předpisy a opatření Katastrální úřad pro Ústecký kraj zveřejnil novou aktualitu: Nabídka volného pracovního místa - Vedoucí oddělení metodiky a kontroly v kanceláři ředitele katastrálního úřadu na Katastrálním úřadu pro Ústecký kraj20200203 - volné místo - Vedoucí OMaK v kanceláři ředitele katastrálního úřadu na KÚ pro Ústecký kra
3.2.2020 9:52 ČÚZK /Urady/Katastralni-urady/Katastralni-urady/Katastralni-urad-pro-Ustecky-kraj/O-uradu/Aktuality/20200203-volne-misto-Vedouci-OMaK-v-kancelariRevize v k.ú. Levínské Petrovice
3.2.2020 9:07 ČÚZK - předpisy a opatření Katastrální úřad pro Ústecký kraj - Katastrální pracoviště Litoměřicezveřejnil novou aktualitu: Vážení klienti, oznamujeme Vám, že od 1.4.2020 - do 30.11.2020 bude probíhat v katastrálním území Levínské Petrovice obce Lovečkovice revize katastru nemovitostí. Účelem provádění revize je soulad údajů katastru nemovitostí se skutečným stavem v terénu, kdy jsou zjišťovány změny a ověřován dosavadní stav předmětu evidence katastru nemovitostí.
Revize v k.ú. Levínské Petrovice
3.2.2020 9:07 ČÚZK /Urady/Katastralni-urady/Katastralni-urady/Katastralni-urad-pro-Ustecky-kraj/Katastralni-pracoviste/KP-Litomerice/O-uradu/Aktuality/Revize-v-k-u-Levinske-PetroviceRevize v k.ú. Libínky
3.2.2020 9:05 ČÚZK - předpisy a opatření Katastrální úřad pro Ústecký kraj - Katastrální pracoviště Litoměřicezveřejnil novou aktualitu: Vážení klienti, oznamujeme Vám, že od 25.3.2020 - do 31.12.2020 bude probíhat v katastrálním území Libínky obce Polepy revize katastru nemovitostí. Účelem provádění revize je soulad údajů katastru nemovitostí se skutečným stavem v terénu, kdy jsou zjišťovány změny a ověřován dosavadní stav předmětu evidence katastru nemovitostí.
Revize v k.ú. Libínky
3.2.2020 9:05 ČÚZK /Urady/Katastralni-urady/Katastralni-urady/Katastralni-urad-pro-Ustecky-kraj/Katastralni-pracoviste/KP-Litomerice/O-uradu/Aktuality/Revize-v-k-u-LibinkyRevize v k.ú. Račiněves
3.2.2020 9:03 ČÚZK /Urady/Katastralni-urady/Katastralni-urady/Katastralni-urad-pro-Ustecky-kraj/Katastralni-pracoviste/KP-Litomerice/O-uradu/Aktuality/Revize-v-k-u-RacinevesRevize v k.ú. Račiněves
3.2.2020 9:03 ČÚZK - předpisy a opatření Katastrální úřad pro Ústecký kraj - Katastrální pracoviště Litoměřicezveřejnil novou aktualitu: Vážení klienti, oznamujeme Vám, že od 16.3.2020- do 18.12.2020 bude probíhat v katastrálním území Račiněves obce Račiněves revize katastru nemovitostí. Účelem provádění revize je soulad údajů katastru nemovitostí se skutečným stavem v terénu, kdy jsou zjišťovány změny a ověřován dosavadní stav předmětu evidence katastru nemovitostí.
Revize v k.ú. Trnobrany
3.2.2020 9:02 ČÚZK - předpisy a opatření Katastrální úřad pro Ústecký kraj - Katastrální pracoviště Litoměřicezveřejnil novou aktualitu: Vážení klienti, oznamujeme Vám, že od 16.3.2020 - do 18.12.2020 bude probíhat v katastrálním území Trnobrany obce Liběšice revize katastru nemovitostí. Účelem provádění revize je soulad údajů katastru nemovitostí se skutečným stavem v terénu, kdy jsou zjišťovány změny a ověřován dosavadní stav předmětu evidence katastru nemovitostí.
Revize v k.ú. Trnobrany
3.2.2020 9:02 ČÚZK /Urady/Katastralni-urady/Katastralni-urady/Katastralni-urad-pro-Ustecky-kraj/Katastralni-pracoviste/KP-Litomerice/O-uradu/Aktuality/Revize-v-k-u-TrnobranyRevize v k.ú. Nížebohy
3.2.2020 9:01 ČÚZK /Urady/Katastralni-urady/Katastralni-urady/Katastralni-urad-pro-Ustecky-kraj/Katastralni-pracoviste/KP-Litomerice/O-uradu/Aktuality/Revize-v-k-u-NizebohyRevize v k.ú. Nížebohy
3.2.2020 9:01 ČÚZK - předpisy a opatření Katastrální úřad pro Ústecký kraj - Katastrální pracoviště Litoměřicezveřejnil novou aktualitu: Vážení klienti, oznamujeme Vám, že od 12.3.2020 - do 30.12.2020 bude probíhat v katastrálním území Nížebohy obce Budyně nad Ohří revize katastru nemovitostí. Účelem provádění revize je soulad údajů katastru nemovitostí se skutečným stavem v terénu, kdy jsou zjišťovány změny a ověřován dosavadní stav předmětu evidence katastru nemovitostí.
Revize v k.ú. Levín u Litoměřic
3.2.2020 9:00 ČÚZK /Urady/Katastralni-urady/Katastralni-urady/Katastralni-urad-pro-Ustecky-kraj/Katastralni-pracoviste/KP-Litomerice/O-uradu/Aktuality/Revize-v-k-u-Levin-u-LitomericRevize v k.ú. Levín u Litoměřic
3.2.2020 9:00 ČÚZK - předpisy a opatření Katastrální úřad pro Ústecký kraj - Katastrální pracoviště Litoměřicezveřejnil novou aktualitu: Vážení klienti, oznamujeme Vám, že od 9.3.2020 - do 30.11.2020 bude probíhat v katastrálním území Levín u Litoměřic obce Levín revize katastru nemovitostí. Účelem provádění revize je soulad údajů katastru nemovitostí se skutečným stavem v terénu, kdy jsou zjišťovány změny a ověřován dosavadní stav předmětu evidence katastru nemovitostí.
Studenti, přihlaste se do soutěže GISáček. Firmy, přijeďte si vybrat zaměstnance
3.2.2020 7:21 GeoBusinessDalší ročník soutěžní studentské konference GISáček se koná 18. března 2020 v Ostravě. Konečné datum pro zaslání abstraktu referátu je 5. března 2020. Prezentace studentské práce by měla trvat do 10 minut. Konference je otevřená všem studentům bakalářských a magisterských programů všech vysokých škol v České a Slovenské republice a Polsku, kteří zpracovávali v rámci […]
The post Studenti, přihlaste se do soutěže GISáček. Firmy, přijeďte si vybrat zaměstnance appeared first on GeoBusiness.
Studenti, přihlaste se do soutěže GISáček. Firmy, přijeďte si vybrat zaměstnance
3.2.2020 7:21 GeoBusiness Další ročník soutěžní studentské konference GISáček se koná 18. března 2020 v Ostravě. Konečné datum pro zaslání abstraktu referátu je 5. března 2020. Prezentace studentské práce by měla trvat do 10 minut. Konference je otevřená všem studentům bakalářských a magisterských programů všech vysokých škol v České a Slovenské republice a Polsku, kteří zpracovávali v rámci […]Den Země se začal slavit před 50 lety
2.2.2020 16:20 GeoBusiness Druhého února 2020 se v novinách The New York Times objevil celostránkový inzerát, zvoucí všechny, kterým není osud Země lhostejný, k připojení se k již padesátému Dni Země. Výraz „Earth Day“ nebo-li „Den Země“ se poprvé objevil v inzerátu v roce 1970. Den Země je každoroční událost organizovaná 22. dubna. Je změřená na propagaci a podporu […]Den Země se začal slavit před 50 lety
2.2.2020 16:20 GeoBusinessDruhého února 2020 se v novinách The New York Times objevil celostránkový inzerát, zvoucí všechny, kterým není osud Země lhostejný, k připojení se k již padesátému Dni Země. Výraz „Earth Day“ nebo-li „Den Země“ se poprvé objevil v inzerátu v roce 1970. Den Země je každoroční událost organizovaná 22. dubna. Je změřená na propagaci a podporu […]
The post Den Země se začal slavit před 50 lety appeared first on GeoBusiness.
14. kartografický den bude na téma KARTOGRAFIE A SPORT
1.2.2020 9:36 Česká kartografická společnost V pátek 28. února 2020 se uskuteční již čtrnáctý ročník odborného kartografického semináře Kartografický den. Tématem letošního ročníku je Kartografie a sport. Katedra geoinformatiky Univerzity Palackého v Olomouci a Česká kartografická společnost pořádají pravidelně poslední únorový pátek seminář, který je již tradičním setkáním kartografů a odborníků na vybranou tematiku. Hlavním cílem všech kartografických dnů je prezentace moderního pojetí tematického mapování v geovědních […]Dejte svůj hlas v soutěži pozemkových úprav. Žít krajinou 2019
1.2.2020 0:10 ZeměměřičOd 1. do 29. února 2020 může veřejnost svým hlasem podpořit některý z třiceti pěti přihlášených projektů v letošním třináctém ročníku soutěže Žít krajinou. Státní pozemkový úřad (SPÚ) ve spolupráci se Stálou komisí senátu pro rozvoj venkova a s Českomoravskou komorou pro pozemkové úpravy hledá pomocí soutěže nejkvalitnější realizovaná tzv. společná zařízení, navrhovaná v pozemkových úpravách. Jednou z udělovaných cen je Cena veřejnosti. O […]
The post Dejte svůj hlas v soutěži pozemkových úprav. Žít krajinou 2019 appeared first on Zeměměřič.
URISA's GIS Hall of Fame Award Nominations Invited
31.1.2020 19:53 GISCafe.com Webcasts-Webinars Des Plaines, IL (January 31, 2020) URISA's GIS Hall of Fame honors persons and organizations that have made significant and original …Galileo performance assessment
31.1.2020 15:16 European GNSS Agency
The Galileo performance is reported in the Galileo Initial Services – Open Service – Quarterly Performance Report, where several key performance indicators are analysed according to criteria (Minimum Performance Levels, MPLs) defined in the Galileo Service Definition document (SDD), published in the European GNSS Service Centre and last updated in May 2019.
As planned, recently the GSA published the Q3 2019 performance report. This report covers the period when a technical incident caused by an equipment malfunction in Galileo last July resulted in a six-day interruption in Galileo navigation and timing services. This had an important effect on the programme and, following the incident, an independent Inquiry Board was set up by the European Commission to investigate its causes and to make recommendations for actions to avoid another such incident in the future.
Performance measurement: how is it done?
Measurement of service performance is one of the key activities of the GSA, the Galileo Service Provider. The GSA’s Galileo Reference Centre, located in Noordwijk, the Netherlands, plays a crucial role in monitoring the Galileo performance .
The Galileo Reference Centre (GRC) is one of the Galileo Service Facilities and it supports the provision of services to Galileo users. The GRC is operated by the GSA, providing an independent means of evaluating the performance of the Galileo Service Operator and the quality of the signals in space. The GRC is fully independent of the system and the Galileo Service Operator with respect to both the technical solution and operations, and consists of both a core facility and contributions available in EU Member States, Norway and Switzerland. Data and products from cooperating entities in the Member States make it possible to observe the Galileo signals all over the world at all times, in support of both routine operations and specific performance assessment campaigns.
The minimum performance levels
The MPLs address several parameters of interest, and can be mainly grouped into two categories:
- Accuracy MPLs refer to how well (accurately) the Galileo services perform, whenever the Galileo signals are usable (or “healthy”, as defined in the SDD). This includes:
- Ranging Accuracy; related to the navigation data transmitted by the satellites which is used to calculate the distance between the satellite and the receiver;
- Timing and Frequency Accuracy; related to the parameters that allow the receiver to obtain a precise synchronisation to either Universal Time Coordinated (UTC) or GPS time.
Accuracy MPLs are statistically defined as “95th percentile”, and calculated over a period of 30 days, using a sample of measurements taken every 5 minutes and considering only those epochs where the signals were healthy. In line with other GNSS constellation providers, timing parameters are normalised over a year by averaging the past twelve 30-day periods. For accuracy parameters, the smaller the achieved value, the better.
- Availability MPLs refer to how much time per month (or year) a given performance level is to be met (for which the signals have to be healthy). This includes:
- Per-Slot Availability; related to the amount of time per period that the signals from each satellite are healthy;
- Timing Availability; related to the amount of time per period that the timing parameters are broadcast, and the time synchronisation error is within the specified target;
- Positioning Availability; related to the amount of time per period that the users have enough satellites in view to calculate their position, and the calculated position error is within the specified target.
Availability MPLs are reported as percent, and calculated over a period of 30 days, using a sample of measurements taken every 5 minutes and considering all epochs (healthy or not). Again, in line with other GNSS constellation providers, some parameters are normalised over a year by averaging the past twelve 30-day periods (timing and per-slot availability). For availability parameters, the larger the achieved value, the better.
The Service Definition Document also describes how to assess whether the Galileo signals are healthy or not, by looking into some parameters (“flags”) transmitted by the satellites, and checking the last time when the navigation data was refreshed (it should not be older than 4 hours).
The Galileo performance in Q3 2019
The Galileo system is currently in a partial deployment stage, with some satellites still to be launched and a number of ground infrastructure upgrades on-going to provide redundancy and complete all functionalities. For this reason, the MPL commitments published in the SDD include margins that account for possible planned and unplanned outages. The quarterly performance reports provide visibility on the measured performance and compare it with the MPL. Galileo has regularly performed well above the MPL targets since the declaration of Initial Services in 2016.
The Galileo incident in July 2019 prevented the refresh of the data transmitted by the satellites, therefore eventually the signals were flagged a not healthy and/or the data became outdated. This caused an impact on the availability MPLs that are calculated monthly. These parameters went well below the values typically provided by Galileo, yet in most of the cases (all but two) they stayed above the committed figure, which includes margins for the reasons explained above. The performance report, therefore, displays them as “green” in the dashboard, however the trend chart clearly shows the difference with the months of June and August and the margin with the MPL.
An example is provided below (Figure 12 of the Quarterly Performance Report Q3 2019, page 19) for the positioning availability:

The committed value (MPL) is 77%. Due to the incident in July, the signals were not available for some days and the parameter was only met 81% of the time, whereas in August and September it was met well above 99%. Still, all values are above the target.
Another example (Figure 16 of the Quarterly Performance Report Q3 2019, page 13) for the time determination availability:

In this case, the committed value (MPL) is 87%. Due to the incident in July, the parameter was only met 81% of the time therefore not fulfilling the target, whereas in August and September it was met 100%.
During the 3rd quarter of 2019, whenever the signals were Healthy, they provided good performance. Therefore, the accuracy MPLs were fulfilled despite the incident.
An example is provided below (Figure 2 of the Quarterly Performance Report Q3 2019, page 10) for the ranging accuracy:

The committed value (MPL) is 7 meters, 95%. During July, August and September, 95% of the time where the signals were healthy the error was below 0.5 meters for all satellites. Therefore, the target was largely met.
Next steps
Regardless of the fact that the published MPLs were mostly met due to a proper estimation of the margins associated to the current deployment status, the programme fully recognises the magnitude of the service outage, and is working consistently on actions to increase Galileo’s stability, robustness and resilience. This will translate into a future update of the Service Definition Document, including more stringent commitments with lower margins, and the reporting of the delivered performance according to the new MPLs.
Media note: This feature can be republished without charge provided the European GNSS Agency (GSA) is acknowledged as the source at the top or the bottom of the story. You must request permission before you use any of the photographs on the site. If you republish, we would be grateful if you could link back to the GSA website (http://www.gsa.europa.eu).
Galileo performance assessment
31.1.2020 15:16 European GNSS AgencyThe Galileo performance is reported in the Galileo Initial Services – Open Service – Quarterly Performance Report, where several key performance indicators are analysed according to criteria (Minimum Performance Levels, MPLs) defined in the Galileo Service Definition document (SDD), published in the European GNSS Service Centre and last updated in May 2019.
As planned, recently the GSA published the Q3 2019 performance report. This report covers the period when a technical incident caused by an equipment malfunction in Galileo last July resulted in a six-day interruption in Galileo navigation and timing services. This had an important effect on the programme and, following the incident, an independent Inquiry Board was set up by the European Commission to investigate its causes and to make recommendations for actions to avoid another such incident in the future.
Performance measurement: how is it done?
Measurement of service performance is one of the key activities of the GSA, the Galileo Service Provider. The GSA’s Galileo Reference Centre, located in Noordwijk, the Netherlands, plays a crucial role in monitoring the Galileo performance .
The Galileo Reference Centre (GRC) is one of the Galileo Service Facilities and it supports the provision of services to Galileo users. The GRC is operated by the GSA, providing an independent means of evaluating the performance of the Galileo Service Operator and the quality of the signals in space. The GRC is fully independent of the system and the Galileo Service Operator with respect to both the technical solution and operations, and consists of both a core facility and contributions available in EU Member States, Norway and Switzerland. Data and products from cooperating entities in the Member States make it possible to observe the Galileo signals all over the world at all times, in support of both routine operations and specific performance assessment campaigns.
The minimum performance levels
The MPLs address several parameters of interest, and can be mainly grouped into two categories:
- Accuracy MPLs refer to how well (accurately) the Galileo services perform, whenever the Galileo signals are usable (or “healthy”, as defined in the SDD). This includes:
- Ranging Accuracy; related to the navigation data transmitted by the satellites which is used to calculate the distance between the satellite and the receiver;
- Timing and Frequency Accuracy; related to the parameters that allow the receiver to obtain a precise synchronisation to either Universal Time Coordinated (UTC) or GPS time.
Accuracy MPLs are statistically defined as “95th percentile”, and calculated over a period of 30 days, using a sample of measurements taken every 5 minutes and considering only those epochs where the signals were healthy. In line with other GNSS constellation providers, timing parameters are normalised over a year by averaging the past twelve 30-day periods. For accuracy parameters, the smaller the achieved value, the better.
- Availability MPLs refer to how much time per month (or year) a given performance level is to be met (for which the signals have to be healthy). This includes:
- Per-Slot Availability; related to the amount of time per period that the signals from each satellite are healthy;
- Timing Availability; related to the amount of time per period that the timing parameters are broadcast, and the time synchronisation error is within the specified target;
- Positioning Availability; related to the amount of time per period that the users have enough satellites in view to calculate their position, and the calculated position error is within the specified target.
Availability MPLs are reported as percent, and calculated over a period of 30 days, using a sample of measurements taken every 5 minutes and considering all epochs (healthy or not). Again, in line with other GNSS constellation providers, some parameters are normalised over a year by averaging the past twelve 30-day periods (timing and per-slot availability). For availability parameters, the larger the achieved value, the better.
The Service Definition Document also describes how to assess whether the Galileo signals are healthy or not, by looking into some parameters (“flags”) transmitted by the satellites, and checking the last time when the navigation data was refreshed (it should not be older than 4 hours).
The Galileo performance in Q3 2019
The Galileo system is currently in a partial deployment stage, with some satellites still to be launched and a number of ground infrastructure upgrades on-going to provide redundancy and complete all functionalities. For this reason, the MPL commitments published in the SDD include margins that account for possible planned and unplanned outages. The quarterly performance reports provide visibility on the measured performance and compare it with the MPL. Galileo has regularly performed well above the MPL targets since the declaration of Initial Services in 2016.
The Galileo incident in July 2019 prevented the refresh of the data transmitted by the satellites, therefore eventually the signals were flagged as not healthy and/or the data became outdated. This caused an impact on the availability MPLs that are calculated monthly. These parameters went well below the values typically provided by Galileo, yet in most of the cases (all but two) they stayed above the committed figure, which includes margins for the reasons explained above. The performance report, therefore, displays them as “green” in the dashboard, however the trend chart clearly shows the difference with the months of June and August and the margin with the MPL.
An example is provided below (Figure 12 of the Quarterly Performance Report Q3 2019, page 19) for the positioning availability:
The committed value (MPL) is 77%. Due to the incident in July, the signals were not available for some days and the parameter was only met 81% of the time, whereas in August and September it was met well above 99%. Still, all values are above the target.
Another example (Figure 16 of the Quarterly Performance Report Q3 2019, page 13) for the time determination availability:
In this case, the committed value (MPL) is 87%. Due to the incident in July, the parameter was only met 81% of the time therefore not fulfilling the target, whereas in August and September it was met 100%.
During the 3rd quarter of 2019, whenever the signals were Healthy, they provided good performance. Therefore, the accuracy MPLs were fulfilled despite the incident.
An example is provided below (Figure 2 of the Quarterly Performance Report Q3 2019, page 10) for the ranging accuracy:
The committed value (MPL) is 7 meters, 95%. During July, August and September, 95% of the time where the signals were healthy the error was below 0.5 meters for all satellites. Therefore, the target was largely met.
Next steps
Regardless of the fact that the published MPLs were mostly met due to a proper estimation of the margins associated to the current deployment status, the programme fully recognises the magnitude of the service outage, and is working consistently on actions to increase Galileo’s stability, robustness and resilience. This will translate into a future update of the Service Definition Document, including more stringent commitments with lower margins, and the reporting of the delivered performance according to the new MPLs.
Media note: This feature can be republished without charge provided the European GNSS Agency (GSA) is acknowledged as the source at the top or the bottom of the story. You must request permission before you use any of the photographs on the site. If you republish, we would be grateful if you could link back to the GSA website (http://www.gsa.europa.eu).
Galileo performance assessment
31.1.2020 15:16 European GNSS AgencyThe Galileo performance is reported in the Galileo Initial Services – Open Service – Quarterly Performance Report, where several key performance indicators are analysed according to criteria (Minimum Performance Levels, MPLs) defined in the Galileo Service Definition document (SDD), published in the European GNSS Service Centre and last updated in May 2019.
As planned, recently the GSA published the Q3 2019 performance report. This report covers the period when a technical incident caused by an equipment malfunction in Galileo last July resulted in a six-day interruption in Galileo navigation and timing services. This had an important effect on the programme and, following the incident, an independent Inquiry Board was set up by the European Commission to investigate its causes and to make recommendations for actions to avoid another such incident in the future.
Performance measurement: how is it done?
Measurement of service performance is one of the key activities of the GSA, the Galileo Service Provider. The GSA’s Galileo Reference Centre, located in Noordwijk, the Netherlands, plays a crucial role in monitoring the Galileo performance .
The Galileo Reference Centre (GRC) is one of the Galileo Service Facilities and it supports the provision of services to Galileo users. The GRC is operated by the GSA, providing an independent means of evaluating the performance of the Galileo Service Operator and the quality of the signals in space. The GRC is fully independent of the system and the Galileo Service Operator with respect to both the technical solution and operations, and consists of both a core facility and contributions available in EU Member States, Norway and Switzerland. Data and products from cooperating entities in the Member States make it possible to observe the Galileo signals all over the world at all times, in support of both routine operations and specific performance assessment campaigns.
The minimum performance levels
The MPLs address several parameters of interest, and can be mainly grouped into two categories:
- Accuracy MPLs refer to how well (accurately) the Galileo services perform, whenever the Galileo signals are usable (or “healthy”, as defined in the SDD). This includes:
- Ranging Accuracy; related to the navigation data transmitted by the satellites which is used to calculate the distance between the satellite and the receiver;
- Timing and Frequency Accuracy; related to the parameters that allow the receiver to obtain a precise synchronisation to either Universal Time Coordinated (UTC) or GPS time.
Accuracy MPLs are statistically defined as “95th percentile”, and calculated over a period of 30 days, using a sample of measurements taken every 5 minutes and considering only those epochs where the signals were healthy. In line with other GNSS constellation providers, timing parameters are normalised over a year by averaging the past twelve 30-day periods. For accuracy parameters, the smaller the achieved value, the better.
- Availability MPLs refer to how much time per month (or year) a given performance level is to be met (for which the signals have to be healthy). This includes:
- Per-Slot Availability; related to the amount of time per period that the signals from each satellite are healthy;
- Timing Availability; related to the amount of time per period that the timing parameters are broadcast, and the time synchronisation error is within the specified target;
- Positioning Availability; related to the amount of time per period that the users have enough satellites in view to calculate their position, and the calculated position error is within the specified target.
Availability MPLs are reported as percent, and calculated over a period of 30 days, using a sample of measurements taken every 5 minutes and considering all epochs (healthy or not). Again, in line with other GNSS constellation providers, some parameters are normalised over a year by averaging the past twelve 30-day periods (timing and per-slot availability). For availability parameters, the larger the achieved value, the better.
The Service Definition Document also describes how to assess whether the Galileo signals are healthy or not, by looking into some parameters (“flags”) transmitted by the satellites, and checking the last time when the navigation data was refreshed (it should not be older than 4 hours).
The Galileo performance in Q3 2019
The Galileo system is currently in a partial deployment stage, with some satellites still to be launched and a number of ground infrastructure upgrades on-going to provide redundancy and complete all functionalities. For this reason, the MPL commitments published in the SDD include margins that account for possible planned and unplanned outages. The quarterly performance reports provide visibility on the measured performance and compare it with the MPL. Galileo has regularly performed well above the MPL targets since the declaration of Initial Services in 2016.
The Galileo incident in July 2019 prevented the refresh of the data transmitted by the satellites, therefore eventually the signals were flagged a not healthy and/or the data became outdated. This caused an impact on the availability MPLs that are calculated monthly. These parameters went well below the values typically provided by Galileo, yet in most of the cases (all but two) they stayed above the committed figure, which includes margins for the reasons explained above. The performance report, therefore, displays them as “green” in the dashboard, however the trend chart clearly shows the difference with the months of June and August and the margin with the MPL.
An example is provided below (Figure 12 of the Quarterly Performance Report Q3 2019, page 19) for the positioning availability:

The committed value (MPL) is 77%. Due to the incident in July, the signals were not available for some days and the parameter was only met 81% of the time, whereas in August and September it was met well above 99%. Still, all values are above the target.
Another example (Figure 16 of the Quarterly Performance Report Q3 2019, page 13) for the time determination availability:

In this case, the committed value (MPL) is 87%. Due to the incident in July, the parameter was only met 81% of the time therefore not fulfilling the target, whereas in August and September it was met 100%.
During the 3rd quarter of 2019, whenever the signals were Healthy, they provided good performance. Therefore, the accuracy MPLs were fulfilled despite the incident.
An example is provided below (Figure 2 of the Quarterly Performance Report Q3 2019, page 10) for the ranging accuracy:

The committed value (MPL) is 7 meters, 95%. During July, August and September, 95% of the time where the signals were healthy the error was below 0.5 meters for all satellites. Therefore, the target was largely met.
Next steps
Regardless of the fact that the published MPLs were mostly met due to a proper estimation of the margins associated to the current deployment status, the programme fully recognises the magnitude of the service outage, and is working consistently on actions to increase Galileo’s stability, robustness and resilience. This will translate into a future update of the Service Definition Document, including more stringent commitments with lower margins, and the reporting of the delivered performance according to the new MPLs.
Media note: This feature can be republished without charge provided the European GNSS Agency (GSA) is acknowledged as the source at the top or the bottom of the story. You must request permission before you use any of the photographs on the site. If you republish, we would be grateful if you could link back to the GSA website (http://www.gsa.europa.eu).
rada/odborný rada - právník
31.1.2020 13:01 ČÚZK /Urady/Katastralni-urady/Katastralni-urady/Katastralni-urad-pro-hlavni-mesto-Prahu/Uredni-deska/Oznameni-a-jina-uredni-sdeleni/Volna-mista/DMS/rada-odborny-rada-pravnik-(1)rada/odborný rada - právník
31.1.2020 13:01 ČÚZK - volná místa Katastrální úřad pro hlavní město Prahu - Katastrální pracoviště Praha vypisuje výběrové řízení na místo rada/odborný rada - právníkrada/odborný rada - právník
31.1.2020 13:01 ČÚZK - volná místa Katastrální úřad pro hlavní město Prahu Katastrální pracoviště Praha vypisuje výběrové řízení na místo rada/odborný rada - právníkrada/odborný rada - právník
31.1.2020 13:01 ČÚZK - předpisy a opatření Katastrální úřad pro hlavní město Prahu - Katastrální pracoviště Prahavypisuje výběrové řízení na místo
rada/odborný rada - právník
Aktualizace verze TopoL xT 10.0
31.1.2020 12:00 Topol Software Je připravena nová aktualizace verze TopoL xT 10.0.27, která je ke stažení na našich stránkách."GISCafe Industry Predictions 2020 – Part 5" by Susan Smith
31.1.2020 11:56 GISCafe.com Webcasts-WebinarsPříspěvkové organizace
31.1.2020 11:40 Středočeský kraj Mapová aplikace Příspěvkové organizace byla aktualizována. Data jsou aktuální k 30.01.2020.Rada /odborný rada v oddělení právním č.1 na Katastrálním pracovišti Brno-město
31.1.2020 10:46 ČÚZK - předpisy a opatření Katastrální úřad pro Jihomoravský kraj Katastrální pracoviště Brno-městovypisuje výběrové řízení na místo
Rada /odborný rada v oddělení právním č.1 na Katastrálním pracovišti Brno-město
Rada /odborný rada v oddělení právním č.1 na Katastrálním pracovišti Brno-město
31.1.2020 10:46 ČÚZK - volná místa Katastrální úřad pro Jihomoravský kraj Katastrální pracoviště Brno-město vypisuje výběrové řízení na místo Rada /odborný rada v oddělení právním č.1 na Katastrálním pracovišti Brno-městoRada /odborný rada v oddělení právním č.1 na Katastrálním pracovišti Brno-město
31.1.2020 10:46 ČÚZK /Urady/Katastralni-urady/Katastralni-urady/Katastralni-urad-pro-Jihomoravsky-kraj/Uredni-deska/Oznameni-a-jina-uredni-sdeleni/Volna-mista/DMS/Rada-odborny-rada-v-oddeleni-pravnim-c-1-na-KatasVerze 14.51 obsahují to, co jste chtěli nejvíc
31.1.2020 10:09 GEPROPublikovali jsme verze 14.51 našich produktů MISYS, MISYS-WEB – licenční server, KOKEŠ, Geoportál GEPRO i PROLAND, které obsahují změny, po kterých jste nejčastěji volali.… >>
Lake George, Uganda
31.1.2020 10:00 ESA Observing the Earth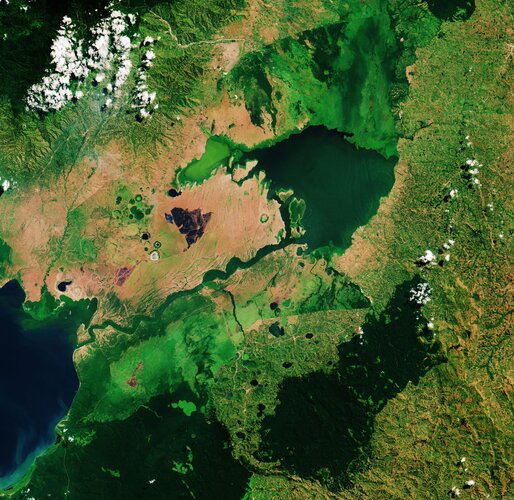 Image:
World Wetlands Day is celebrated internationally each year on 2 February. It marks the anniversary of the signing of the Convention on Wetlands of International Importance, known as the Ramsar Convention, in Ramsar, Iran, on 2 February 1971.
World Wetlands Day raises global awareness about the vital role of wetlands for our planet, paying particular attention to wetland biodiversity.
This Copernicus Sentinel-2 image takes us over Lake George, in western Uganda. In 1988, Lake George was designated as Uganda’s first Ramsar site, given its importance as a centre for biological diversity.
This equatorial lake covers an area of around 250 sq km and has an average depth of around 2.4 metres. Lake George is fed by a complex system of rivers and streams originating from the Rwenzori mountains – supplying a system of permanent swamps surrounding the lake.
A dense fringe of wetland grass, visible in bright green, can be seen around the edges of the lake in the centre of the image.
The wetlands provide a natural living space for a number of mammals including elephants, hippopotamus and antelope. They also provide a habitat for over 150 species of birds including several rare species such as the saddle-billed stork.
Seen from above, the waters of Lake George appear green as a result of the thick concentration of blue-green algae. Metal pollution, mine seepage and agricultural runoff has caused serious pollution to the lake’s waters and are severely impacting the lake’s health.
Lake George drains through the Kazinga Channel in the image’s centre. The wide, 32km long channel connects Lake George with Lake Edward, which lies on the border between Uganda and the Democratic Republic of the Congo.
The Kazinga Channel flows through the Queen Elizabeth National Park. The almost 2000 sq km park is known for its wildlife including the African buffalo and the Nile crocodile.
The park is also famous for its volcanic features, including volcanic cones and deep craters which can be seen dotted around the image. Many contain crater lakes, including the Katwe crater lake, whose salt deposits have been mined for centuries.
Sentinel-2 is a two-satellite mission to supply the coverage and data delivery needed for Europe’s Copernicus programme. The mission’s frequent revisits over the same area and high spatial resolution allow changes in inland water bodies to be closely monitored.
This image is also featured on the Earth from Space video programme.
Earth from Space: Lake George
31.1.2020 10:00 ESA Observing the Earth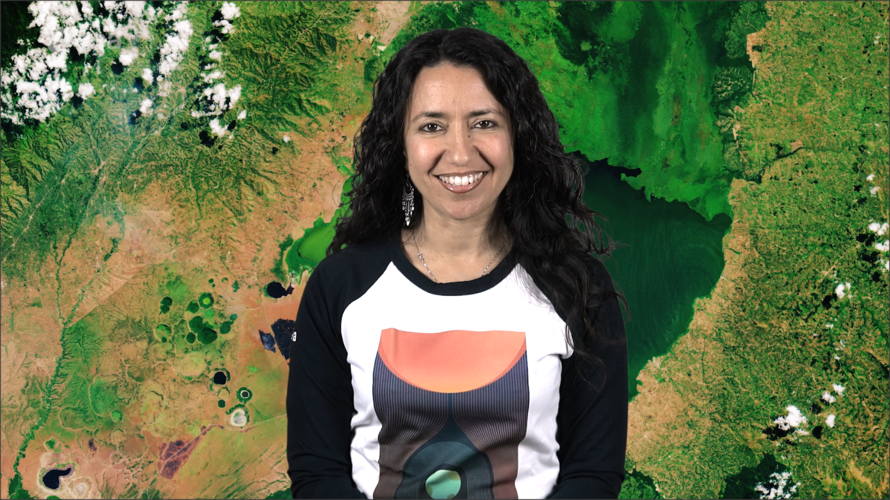 Video:
00:03:07
Video:
00:03:07
Ahead of World Wetlands Day, celebrated internationally each year on 2 February, this week's edition of the Earth from Space programme features a Copernicus Sentinel-2 image over Lake George in western Uganda. In 1988, Lake George was designated as Uganda’s first site under the Ramsar Convention - an international treaty for the conservation and sustainable use of wetlands.
See also Lake George, Uganda to download the image.
Earth from Space: Lake George
31.1.2020 10:00 ESA Observing the Earth
Video:
00:03:07
Ahead of World Wetlands Day, celebrated internationally each year on 2 February, this week's edition of the Earth from Space programme features a Copernicus Sentinel-2 image over Lake George in western Uganda. In 1988, Lake George was designated as Uganda’s first site under the Ramsar Convention - an international treaty for the conservation and sustainable use of wetlands.
See also Lake George, Uganda to download the image.
Aplikace mapující šíření koronaviru
31.1.2020 9:22 ARCDATAKoronavirus 2019-nCoV se z města Wuhan rozšířil již téměř do všech čínských provincií a překročil i čínské hranice. Byl identifikován u nemocných nejen v Jihovýchodní Asii, ale několik případů je již také v Evropě nebo Severní Americe.
Aktuální situaci mapuje aplikace vytvořená v prostředí Operations Dashboard for ArcGIS, kterou připravilo Centrum pro systémové vědy a inženýrství (CSSE) na univerzitě Johnse Hopkinse. Data aplikace čerpá hned z několika zdrojů a jsou pravidelně aktualizována. Více informací o aplikaci a zdrojích dat naleznete v této tiskové zprávě.

Introducing the Mesa® 3 Rugged Tablet Running Android™ by Juniper Systems
31.1.2020 9:00 GISCafe.com Webcasts-Webinars January 29, 2020 -- Logan, UT – Juniper Systems, Inc. is excited to announce the release of the Mesa 3 Rugged Tablet running on the …Aktualizace datového skladu ÚAP
31.1.2020 7:30 Ústecký krajUpozorňujeme uživatele Geoportálu územně analytických podkladů, že v týdnech od 27.1.2020 do 7.2.2020 bude probíhat úprava funkčních komponent geoportálu v souvislosti s přechodem na novou verzi datového modelu. V tomto termínu nebude funkční výdej dat.
Mapa radonového indexu ČR 1 : 50 000 (GEOČR50)
31.1.2020 1:00 Cenia - Katalog metadat ČR - INSPIRE ArcGIS Server služba zobrazuje výsledky mapování radonového indexu na území České republiky v měřítku 1 : 50 000.Nový dotační program Ministerstva zahraničních věcí ČR
31.1.2020 0:00 Geografický ústav MUDne 6. ledna vyhlásilo Ministerstvo zahraničních věcí ČR dotační program Posilování kapacit veřejných vysokých škol v rozvojových zemích na podporu realizace projektů v těchto zemích: Bosna a Hercegovina, Etiopie, Gruzie, Kambodža, Moldavsko, Zambie a Ukrajina.
Termín pro předkládání žádostí je stanoven na 31. leden 2020, 14 hodin.
Aktivity podpořené v rámci programu zahrnují zejména odborné výměny pedagogů z českých a partnerských veřejných vysokých škol, realizaci společných pedagogických aktivit v rámci meziuniverzitní spolupráce, realizaci specializovaných krátkodobých studijních pobytů učitelů i studentů z rozvojových zemí na českých veřejných vysokých školách, včetně předávání českého know-how v oblasti managementu vysokého školství či v odborné publikační činnosti, apod.
Součástí programu je také podpora navazování nových vztahů mezi českými veřejnými vysokými školami a veřejnými vysokými školami v rozvojových zemích.
Detailní informace - https://www.mzv.cz/jnp/cz/zahranicni_vztahy/rozvojova_spoluprace/aktualne/posilovani_kapacit_verejnych_vysokych.html
Výběrové řízení na jazykové kurzy a studijní pobyty v Maďarsku
31.1.2020 0:00 Geografický ústav MUBylo vypsáno dodatečné výběrové řízení na neobsazená místa na letních jazykových kurzech a na studijní pobyty pro studenty BSP, MSP a DSP v Maďarsku.
Termín odevzdání přihlášek je 31. ledna 2020 do 12:00 hodin.
Detailní informace - https://www.dzs.cz/file/8611/MA%C4%8EARSKO%20VR_AIA_19_aktualizovan%C3%BD.pdf
Spoločné vyhlásenie stavovských a odborných organizácií k PÚ
30.1.2020 23:00 Komora geodetů a kartografů SRUSGIF Accredits New Universities' GEOINT Programs
30.1.2020 21:38 GISCafe.com Webcasts-Webinars Johns Hopkins University and Saint Louis University added to the Foundation’s growing Collegiate Accreditation Program. The University of …Kongsberg Geospatial and MartinUAV partner to provide real-time ISR Drone Solutions for the Canadian defence and security market
30.1.2020 17:22 GISCafe.com Webcasts-Webinars Combining the real-time Kongsberg UAV mission management system with the MartinUAV V-BatTM long endurance VTOL aircraft provides an end-to-end …EagleView Launches EagleView Works™, An All-in-One Sales Assistant App to Help Contractors Win More Business
30.1.2020 17:22 GISCafe.com Webcasts-Webinars EagleView Works™ enables roofing contractors to estimate, quote and close business fasterBELLEVUE, Wash., Jan. 30, 2020 — (PRNewswire) …
Renoworks Enters into Agreement with EagleView to Intregrate EagleView Property Measurements into Renoworks FastTrack Platform
30.1.2020 17:22 GISCafe.com Webcasts-Webinars CALGARY, Jan. 30, 2020 — (PRNewswire) — Renoworks Software Inc. (TSXV: RW) ("Renoworks"), the leading end-to-end visualization …Inpixon Releases New Features for Indoor Mapping Platform
30.1.2020 17:22 GISCafe.com Webcasts-Webinars Enhances Map Creation and Management; Extends Outdoor-Indoor Mapping Capabilities to iOS, Android and Web AppsPALO ALTO, Calif. and TORONTO, Jan. …
DroneUp Launches Airspace Planner with Native LAANC Integration
30.1.2020 11:25 GISCafe.com Webcasts-Webinars Virginia Beach, VA (January 28, 2020) -- DroneUp, LLC, an end-to-end drone pilot service provider for aerial data collection, is pleased to announce …500 let od první cesty kolem světa
30.1.2020 7:00 Česká asociace pro geoinformace Institut Cervantes v Praze zve na přednášku věnovanou první cestě kolem světa, kterou uskutečnili mořeplavci Magalh?es a Elcano a jejíž 500. výročí si tímto připomínáme. Přednáška se bude konat online, a to úterý 1. prosince od 18:00 na následujícím odkazu: https://zoom.us/j/93219549496?pwd=enJkR1MzaU9JVUxZVk9aTjhpZklUUT09Se svými příspěvky vystoupí historikové
Swiss Air-Rescue Rega Deploys Hexagon’s Computer-Aided Dispatch Solution
30.1.2020 2:00 Hexagon Safety & Infrastructure Hosted, state-of-the-art CAD system delivers modern, comprehensive solution with Rescuetrack integrationSwiss Air-Rescue Rega Deploys Hexagon’s Computer-Aided Dispatch Solution
30.1.2020 2:00 Hexagon Safety & InfrastructureSwiss Air-Rescue Rega Deploys Hexagon’s Computer-Aided Dispatch Solution
30.1.2020 2:00 Hexagon Safety & Infrastructure Hosted, state-of-the-art CAD system delivers modern, comprehensive solution with Rescuetrack integrationSkyfront partners with Silvus Technologies to provide long-range Unmanned Aerial Vehicles for BVLOS applications
30.1.2020 0:16 GISCafe.com Webcasts-Webinars MENLO PARK, Calif., Jan. 29, 2020 — (PRNewswire) — Skyfront, the leading provider of hybrid-electric Unmanned Aerial Vehicles (UAVs), …Multiple Faculty Positions in GIS, CyberGIS, and Geospatial Data Science at UIUC
29.1.2020 21:54 UIUC is developing several exciting education and research programs on cyberGIS and geospatial data science, and thus recruiting multiple faculty positions in GIS, CyberGIS, and Geospatial Data Science: http://go.illinois.edu/CyberGIS_geospatial_opportunities. Application deadline is February 17, 2020.FYI — Post-doc in Mobility Information Engineering
29.1.2020 21:44 Post-doc in Mobility Information Engineering 100%, Zurich, temporary https://www.jobs.ethz.ch/job/view/JOPG_ethz_7R9Rl0z6QH6GC0M9Cv The Institute of Cartography and Geoinformation is looking for a highly motivated post-doctoral candidate in the area of Mobility Information Engineering at the Chair of Geoinformation Engineering (www.gis.ethz.ch), starting at the earliest possible date. Job description The main objective of this Post-doc position is the development, implementation […]Open position at Aalto University in Helsinki: Tenure Track Assistant Professor in Geoinformation Technology
29.1.2020 21:39 Open position at Aalto University in Finland: Tenure Track Assistant Professor in Geoinformation Technology, https://www.aalto.fi/en/open-positions/tenure-track-assistant-professor-in-geoinformation-technologyTenured Professor in Geographic Information Science and Dangermond Endowed Chair Position – UC Santa Barbara
29.1.2020 21:37 Tenured Faculty Position Geographic Information Science (GIScience) – Department of Geography The University of California, Santa Barbara, Department of Geography invites applications for the Jack and Laura Dangermond Endowed Chair in Geography. This will be a Tenured faculty position at the level of Associate or Full Professor in Geographic Information Science, with an anticipated start […]Postdoctoral Scholar in Geographic Visualization and Spatial Cognition
29.1.2020 21:36 Applications are still accepted for a postdoctoral scholar position in Geographic Visualization and Spatial Cognition at the UCSB Department of Geography.The postdoc will be engaged in an NSF funded project entitled: “Visualizing Motion: A Framework for the Cartography of Movement”. The project aims to develop and evaluate cartographic theories and tools to understand how humans perceive […]TomTom Traffic Index: Global Traffic Congestion Up as Bengaluru takes Crown of ‘World’s Most Traffic Congested City’
29.1.2020 17:28 GISCafe.com Webcasts-Webinars Ninth edition of the annual TomTom Traffic Index provides detailed insights on live and historic road congestion levels in cities around the …Hexagon Strengthens HxGN Content Program With Acquisition of COWI's Mapping Business
29.1.2020 17:28 GISCafe.com Webcasts-Webinars NACKA STRAND, Sweden, Jan. 29, 2020 — (PRNewswire) — Hexagon AB, a global leader in sensor, software and autonomous solutions, today …Textron Reports Fourth Quarter 2019 Results; Announces 2020 Financial Outlook
29.1.2020 17:28 GISCafe.com Webcasts-Webinars Revenue growth of $285 million, up 7.6% from prior yearThe new Citation Longitude enters service with 13 aircraft deliveries in the quarter
EPS …
CoreLogic Natural Hazard Report Reveals Serious Delinquency Rates Tripled in Recent Disaster-affected Regions
29.1.2020 17:28 GISCafe.com Webcasts-Webinars Annual natural hazard summary examines how previous disasters are impacting today’s micro economies; Looks at the catastrophe and weather events of …Carlson Software Names Sandor Vegh Regional Sales Director for Central Europe
29.1.2020 15:22 Carlson Software MAYSVILLE, Kentucky, U.S.A. (January, 2020) – Carlson Software recently named Hungarian native Sandor Vegh, P.S., as its Regional Sales Director for its Land Development Division in Central Europe. The countries he will be covering include Hungary, the Czech Republic, Austria, Germany, and Bulgaria. While Vegh will remain based in Columbus, Ohio, he is both close […]MAPPS Presents the 2019 Geospatial Products and Services Excellence Awards
29.1.2020 12:20 GISCafe.com Webcasts-Webinars Forest Hill, MD (January 2020) -- MAPPS honored members with the 2019 Geospatial Excellence Awards as part of their …Celofiremní školení v hotelu Medlov na Vysočině
29.1.2020 10:38 Hrdlička Letošní školení v rámci firem Hrdlička Group proběhlo v zasněžené oblasti..HRDLIČKA spol. s r.o. - Celofiremní školení v hotelu Medlov na Vysočině
29.1.2020 10:38 Hrdlička Letošní školení v rámci firem Hrdlička Group proběhlo v zasněžené oblasti..GEOINT 2020 Registration and Housing Now Open
29.1.2020 10:00 GISCafe.com Webcasts-Webinars Leading intelligence conference to offer countless opportunities to learn and exchange ideasHerndon, Virginia (January 28, 2020) …
The Road Asset Management for the Campania Region
29.1.2020 9:49 GISCafe.com Webcasts-Webinars 28 January, 2020, Bologna Italy–SITECO Infomatica SRL together with Sina, wins the tender awarded by ACaMIR. At the end of the …
Pobočka Havlíčkův Brod pořádá Den otevřených dveří
29.1.2020 0:00 Státní pozemkový úřad Trápí vás současné problémy s vodou v krajině? Potřebujete obnovit cesty nebo efektivně navrhnout nové? Chcete znát možnosti boje s erozí zemědělské půdy nebo máte v katastru analogovou mapu či grafické příděly?Řešením mohou být pozemkové úpravy.
Pozemkové úpravy a verejné politiky
28.1.2020 22:22 Komora pozemkových úprav SR
Verejná politika je v tom najširšom ponímaní definovaná a vnímaná ako množina navzájom súvisiacich rozhodnutí, na ktoré pôsobili mnohé okolnosti, ako aj osobné, skupinové či organizačné vplyvy - je nutné ich poznať a vedieť využívať v rámci nášho právneho systému....
Pozemkové úpravy a verejné politiky
28.1.2020 22:22 Komora pozemkových úprav SRVerejná politika je v tom najširšom ponímaní definovaná a vnímaná ako množina navzájom súvisiacich rozhodnutí, na ktoré pôsobili mnohé okolnosti, ako aj osobné, skupinové či organizačné vplyvy. Vládnutie, správa vecí verejných, riadenie štátu sa nevyhnú takýmto vplyvom a preto je nutné ich...
S&P CoreLogic Case-Shiller Index Continues Upward Trend For Annual Home Price Gains
28.1.2020 22:14 GISCafe.com Webcasts-Webinars NEW YORK, Jan. 28, 2020 — (PRNewswire) — S&P Dow Jones Indices today released the latest results for the S&P CoreLogic …Seminář Geodézie ve stavebnictví a průmyslu 2020
28.1.2020 19:19 ZeměměřičSeminář Geodézie ve stavebnictví a průmyslu je součástí doprovodného programu Mezinárodního stavebního veletrhu v Brně. Akce se koná ve čtvrtek 27. února 2020 v Brně od 9:30 hod. Akce je zařazena do programu celoživotního vzdělávání členů ČKAIT a ohodnocena 1 kreditním bodem. 1. BLOK 9:30 – 11:00 Radomír Havlíček (Správa železnic, státní organizace): Digitalizace prostorových informací železniční sítě z pohledu hlavního […]
The post Seminář Geodézie ve stavebnictví a průmyslu 2020 appeared first on Zeměměřič.
Unacast Partners with Mapidea to Deliver Geospatial Data Offerings
28.1.2020 16:50 GISCafe.com Webcasts-Webinars Unacast's partnership with Mapidea will allow a wider group of big name brands to utilize location data.NEW YORK, Jan. 28, 2020 — (PRNewswire) …